Estimated Value: $890,528 - $1,218,000
5
Beds
4
Baths
2,516
Sq Ft
$411/Sq Ft
Est. Value
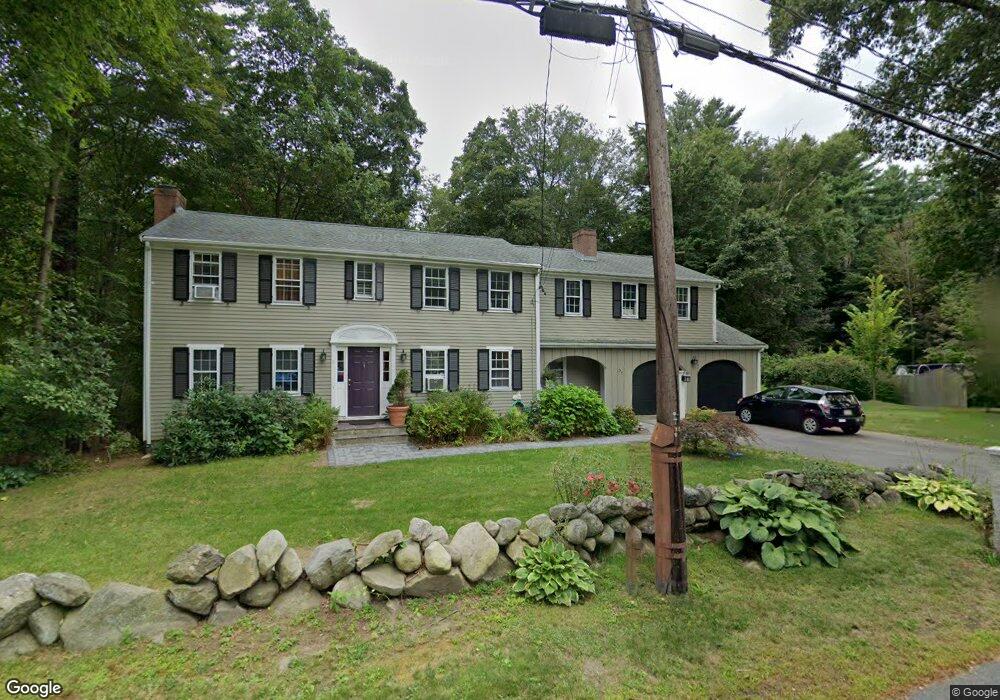
About This Home
This home is located at 91 Concord Rd, Acton, MA 01720 and is currently estimated at $1,033,132, approximately $410 per square foot. 91 Concord Rd is a home located in Middlesex County with nearby schools including Acton-Boxborough Regional High School and Nashoba Brooks School.
Ownership History
Date
Name
Owned For
Owner Type
Purchase Details
Closed on
Aug 12, 2005
Sold by
Fearer Jacqueline M and Fearer Matthew S
Bought by
Bryan Irene Durand and Bryan Joseph G
Current Estimated Value
Home Financials for this Owner
Home Financials are based on the most recent Mortgage that was taken out on this home.
Original Mortgage
$359,000
Interest Rate
5.54%
Mortgage Type
Purchase Money Mortgage
Purchase Details
Closed on
Jan 4, 1995
Sold by
Carr Howard L and Gilliam Ellen M
Bought by
Fearer Matthew S
Purchase Details
Closed on
Jan 26, 1989
Sold by
Reynolds Robert W
Bought by
Carr Howard L
Create a Home Valuation Report for This Property
The Home Valuation Report is an in-depth analysis detailing your home's value as well as a comparison with similar homes in the area
Home Values in the Area
Average Home Value in this Area
Purchase History
| Date | Buyer | Sale Price | Title Company |
|---|---|---|---|
| Bryan Irene Durand | $640,000 | -- | |
| Fearer Matthew S | $295,000 | -- | |
| Carr Howard L | $360,000 | -- |
Source: Public Records
Mortgage History
| Date | Status | Borrower | Loan Amount |
|---|---|---|---|
| Open | Carr Howard L | $458,383 | |
| Closed | Bryan Irene Durand | $359,000 | |
| Previous Owner | Carr Howard L | $75,000 | |
| Previous Owner | Carr Howard L | $203,150 |
Source: Public Records
Tax History
| Year | Tax Paid | Tax Assessment Tax Assessment Total Assessment is a certain percentage of the fair market value that is determined by local assessors to be the total taxable value of land and additions on the property. | Land | Improvement |
|---|---|---|---|---|
| 2025 | $13,440 | $783,700 | $316,800 | $466,900 |
| 2024 | $12,573 | $754,200 | $316,800 | $437,400 |
| 2023 | $12,260 | $698,200 | $288,100 | $410,100 |
| 2022 | $11,608 | $596,800 | $250,400 | $346,400 |
| 2021 | $11,329 | $560,000 | $231,700 | $328,300 |
| 2020 | $10,686 | $555,400 | $231,700 | $323,700 |
| 2019 | $10,431 | $538,500 | $231,700 | $306,800 |
| 2018 | $10,250 | $528,900 | $231,700 | $297,200 |
| 2017 | $9,991 | $524,200 | $231,700 | $292,500 |
| 2016 | $9,832 | $511,300 | $233,200 | $278,100 |
| 2015 | $9,645 | $506,300 | $233,200 | $273,100 |
| 2014 | $9,336 | $480,000 | $233,200 | $246,800 |
Source: Public Records
Map
Nearby Homes
Your Personal Tour Guide
Ask me questions while you tour the home.