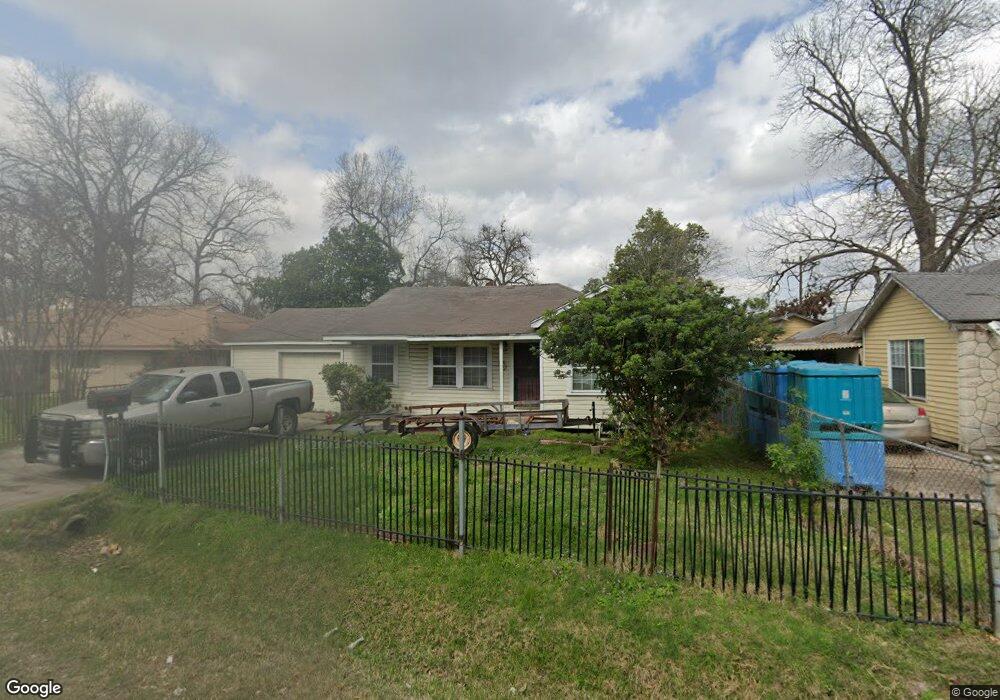
91 De Boll St Houston, TX 77022
Northside-Northline NeighborhoodEstimated Value: $202,433 - $239,000
3
Beds
1
Bath
1,316
Sq Ft
$171/Sq Ft
Est. Value
About This Home
This home is located at 91 De Boll St, Houston, TX 77022 and is currently estimated at $225,358, approximately $171 per square foot. 91 De Boll St is a home located in Harris County with nearby schools including Burbank Elementary School, Burbank Middle School, and Sam Houston Math, Science & Technology Center.
Ownership History
Date
Name
Owned For
Owner Type
Purchase Details
Closed on
Jun 17, 2025
Sold by
Torres Rosalva
Bought by
Layton Jose Alfredo
Current Estimated Value
Purchase Details
Closed on
Dec 26, 2018
Sold by
Martinez Ralph
Bought by
Layton Jose Alfredo and Torres Rosalva
Purchase Details
Closed on
Sep 26, 2013
Sold by
Martinez Heriberto and Martinez Mary L
Bought by
Martinez Ralph
Create a Home Valuation Report for This Property
The Home Valuation Report is an in-depth analysis detailing your home's value as well as a comparison with similar homes in the area
Home Values in the Area
Average Home Value in this Area
Purchase History
| Date | Buyer | Sale Price | Title Company |
|---|---|---|---|
| Layton Jose Alfredo | $10,000 | None Listed On Document | |
| Layton Jose Alfredo | $200 | None Available | |
| Martinez Ralph | -- | None Available |
Source: Public Records
Tax History Compared to Growth
Tax History
| Year | Tax Paid | Tax Assessment Tax Assessment Total Assessment is a certain percentage of the fair market value that is determined by local assessors to be the total taxable value of land and additions on the property. | Land | Improvement |
|---|---|---|---|---|
| 2025 | $1,592 | $190,205 | $67,463 | $122,742 |
| 2024 | $1,592 | $190,205 | $67,463 | $122,742 |
| 2023 | $1,285 | $173,542 | $67,463 | $106,079 |
| 2022 | $2,670 | $125,000 | $48,830 | $76,170 |
| 2021 | $2,569 | $127,676 | $48,830 | $78,846 |
| 2020 | $2,427 | $109,818 | $48,830 | $60,988 |
| 2019 | $2,305 | $91,103 | $31,370 | $59,733 |
| 2018 | $1,922 | $75,939 | $33,732 | $42,207 |
| 2017 | $1,920 | $75,939 | $33,732 | $42,207 |
| 2016 | $1,920 | $75,939 | $33,732 | $42,207 |
| 2015 | $1,856 | $72,195 | $33,732 | $38,463 |
| 2014 | $1,856 | $72,195 | $33,732 | $38,463 |
Source: Public Records
Map
Nearby Homes
- 90 Burress St Unit B
- 90 Burress St Unit A
- 70 Burress St
- 108 Fichter St
- 61 Trenwood Ln
- 44 Farrell St
- 216 Burress St
- 45 Wellford St
- 56 Wellford St
- 249 De Boll St
- 132 Grothe Ln
- 253 De Boll St
- 9625 Fulton St
- 91 Burbank St
- 202 Burbank St
- 318 Charlock St
- 110 Luetta St
- 108 Luetta St
- 106 Luetta St
- 104 Luetta St