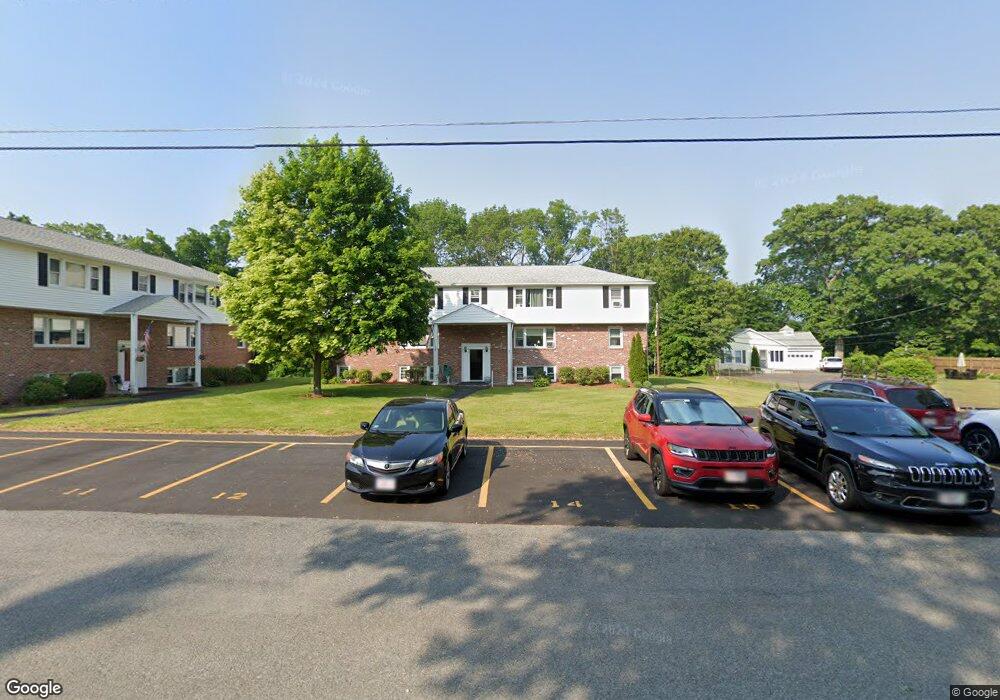
91 Elm St Unit 4A Uxbridge, MA 01569
Estimated Value: $252,000 - $289,000
2
Beds
1
Bath
712
Sq Ft
$376/Sq Ft
Est. Value
About This Home
This home is located at 91 Elm St Unit 4A, Uxbridge, MA 01569 and is currently estimated at $267,958, approximately $376 per square foot. 91 Elm St Unit 4A is a home located in Worcester County with nearby schools including Uxbridge High School, Whitinsville Christian School, and Our Lady of the Valley Regional School.
Ownership History
Date
Name
Owned For
Owner Type
Purchase Details
Closed on
Aug 5, 2004
Sold by
Grimala Catina and Grimala Paul
Bought by
Cyr Steven P
Current Estimated Value
Home Financials for this Owner
Home Financials are based on the most recent Mortgage that was taken out on this home.
Original Mortgage
$139,050
Outstanding Balance
$69,867
Interest Rate
6.2%
Mortgage Type
Purchase Money Mortgage
Estimated Equity
$198,091
Purchase Details
Closed on
Mar 30, 2000
Sold by
Bickford Merle Winslow
Bought by
Grimala Paul E
Home Financials for this Owner
Home Financials are based on the most recent Mortgage that was taken out on this home.
Original Mortgage
$61,250
Interest Rate
8.4%
Mortgage Type
Purchase Money Mortgage
Purchase Details
Closed on
May 1, 1997
Sold by
Barnes Marcia G
Bought by
Bickford Merle Winslow
Home Financials for this Owner
Home Financials are based on the most recent Mortgage that was taken out on this home.
Original Mortgage
$38,000
Interest Rate
7.85%
Mortgage Type
Purchase Money Mortgage
Create a Home Valuation Report for This Property
The Home Valuation Report is an in-depth analysis detailing your home's value as well as a comparison with similar homes in the area
Home Values in the Area
Average Home Value in this Area
Purchase History
| Date | Buyer | Sale Price | Title Company |
|---|---|---|---|
| Cyr Steven P | $135,000 | -- | |
| Grimala Paul E | $64,500 | -- | |
| Bickford Merle Winslow | $40,000 | -- |
Source: Public Records
Mortgage History
| Date | Status | Borrower | Loan Amount |
|---|---|---|---|
| Open | Cyr Steven P | $139,050 | |
| Previous Owner | Bickford Merle Winslow | $61,250 | |
| Previous Owner | Bickford Merle Winslow | $38,000 |
Source: Public Records
Tax History Compared to Growth
Tax History
| Year | Tax Paid | Tax Assessment Tax Assessment Total Assessment is a certain percentage of the fair market value that is determined by local assessors to be the total taxable value of land and additions on the property. | Land | Improvement |
|---|---|---|---|---|
| 2025 | $25 | $191,100 | $0 | $191,100 |
| 2024 | $2,282 | $176,600 | $0 | $176,600 |
| 2023 | $2,300 | $164,900 | $0 | $164,900 |
| 2022 | $1,957 | $129,100 | $0 | $129,100 |
| 2021 | $2,046 | $129,300 | $0 | $129,300 |
| 2020 | $1,979 | $118,200 | $0 | $118,200 |
| 2019 | $2,051 | $118,200 | $0 | $118,200 |
| 2018 | $1,399 | $81,500 | $0 | $81,500 |
| 2017 | $1,208 | $71,200 | $0 | $71,200 |
| 2016 | $1,214 | $69,100 | $0 | $69,100 |
| 2015 | $1,176 | $67,600 | $0 | $67,600 |
Source: Public Records
Map
Nearby Homes
- 129 Elm St Unit Lot 7
- 307 N Main St
- 36 Elm St
- 0 Homestead Ave
- 3 Strathmore Shire Unit A
- 35 Highland Park Unit 35
- 235 Rivulet St
- 113 Rogerson Crossing Unit 113
- 50 Carrington Ln
- 75 Lake St
- 7 Jefferson Ct Unit 7
- 94 Heritage Dr Unit 94
- 48 Homeward Ave
- 99 Country Club Dr
- 72 Homeward Ave
- 0 Louis St
- 44 Arthur Dr Unit 44
- 60 Tyler Dr
- 20 Nature View Dr Unit 20
- 128 Linwood Ave
- 91 Elm St Unit 6A
- 91 Elm St Unit 5A
- 91 Elm St Unit 3A
- 91 Elm St Unit 2A
- 91 Elm St Unit 1A
- 91 Elm St Unit 3-91
- 91 Elm St Unit 5
- 91 Elm St Unit 2-91
- 91 Elm St Unit 4 91
- 91 Elm St Unit 6
- 93 Elm St Unit 12B
- 93 Elm St Unit 11B
- 93 Elm St Unit 10B
- 93 Elm St Unit 9B
- 93 Elm St Unit 8B
- 93 Elm St Unit 7B
- 93 Elm St Unit 6
- 93 Elm St Unit 5-B
- 93 Elm St Unit 3
- 93 Elm St Unit 2,93