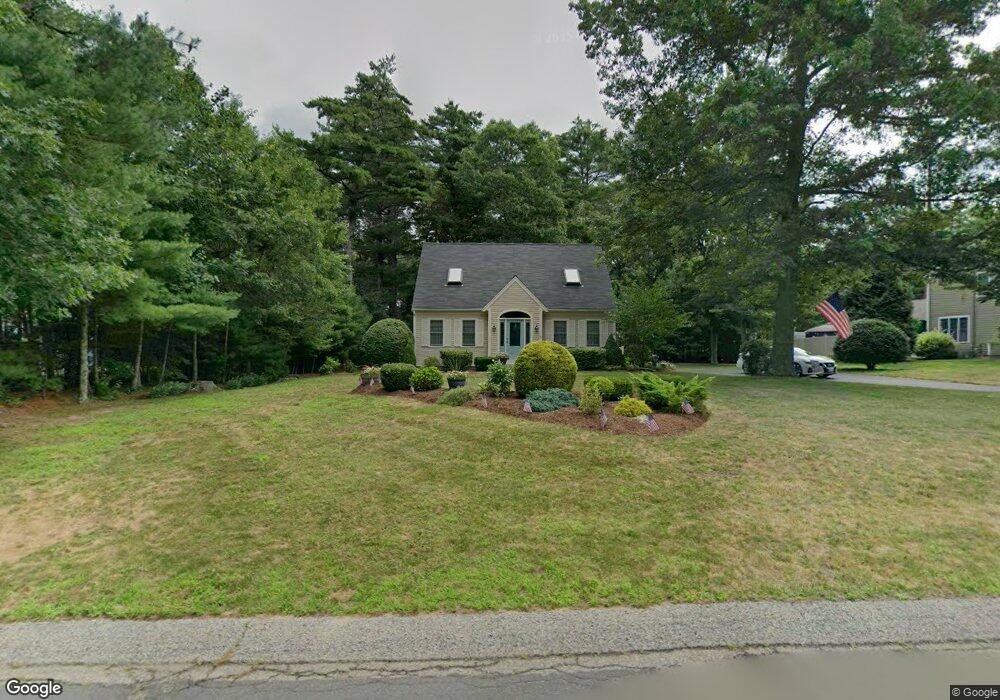
91 Foxworth Ln Kingston, MA 02364
Estimated Value: $541,000 - $848,000
3
Beds
2
Baths
1,434
Sq Ft
$457/Sq Ft
Est. Value
About This Home
This home is located at 91 Foxworth Ln, Kingston, MA 02364 and is currently estimated at $654,667, approximately $456 per square foot. 91 Foxworth Ln is a home located in Plymouth County with nearby schools including Silver Lake Regional High School, Kingston Elementary School, and Kingston Intermediate School.
Ownership History
Date
Name
Owned For
Owner Type
Purchase Details
Closed on
Jan 21, 1993
Sold by
Roberts Rt
Bought by
Price Donald R and Price Kathleen M
Current Estimated Value
Home Financials for this Owner
Home Financials are based on the most recent Mortgage that was taken out on this home.
Original Mortgage
$65,000
Interest Rate
8.15%
Mortgage Type
Purchase Money Mortgage
Create a Home Valuation Report for This Property
The Home Valuation Report is an in-depth analysis detailing your home's value as well as a comparison with similar homes in the area
Home Values in the Area
Average Home Value in this Area
Purchase History
| Date | Buyer | Sale Price | Title Company |
|---|---|---|---|
| Price Donald R | $152,000 | -- |
Source: Public Records
Mortgage History
| Date | Status | Borrower | Loan Amount |
|---|---|---|---|
| Open | Price Donald R | $80,000 | |
| Closed | Price Donald R | $25,000 | |
| Closed | Price Donald R | $65,000 |
Source: Public Records
Tax History Compared to Growth
Tax History
| Year | Tax Paid | Tax Assessment Tax Assessment Total Assessment is a certain percentage of the fair market value that is determined by local assessors to be the total taxable value of land and additions on the property. | Land | Improvement |
|---|---|---|---|---|
| 2025 | $7,041 | $542,900 | $219,900 | $323,000 |
| 2024 | $6,739 | $530,200 | $219,900 | $310,300 |
| 2023 | $6,590 | $493,300 | $219,900 | $273,400 |
| 2022 | $6,584 | $451,600 | $199,800 | $251,800 |
| 2021 | $6,540 | $406,700 | $199,800 | $206,900 |
| 2020 | $6,434 | $395,200 | $199,800 | $195,400 |
| 2019 | $6,373 | $387,200 | $207,800 | $179,400 |
| 2018 | $6,006 | $365,100 | $211,000 | $154,100 |
| 2017 | $5,584 | $338,400 | $188,000 | $150,400 |
| 2016 | $5,290 | $300,400 | $171,900 | $128,500 |
| 2015 | $5,052 | $298,200 | $171,900 | $126,300 |
| 2014 | $4,981 | $298,600 | $174,500 | $124,100 |
Source: Public Records
Map
Nearby Homes
- 46 Foxworth Ln
- 2 Clinton Terrace
- 26 Brookings Dr
- 79 Wapping Rd
- 83 Wapping Rd
- 0 Wildwood Cir
- 231 Main St
- 228 Main St
- 7 Green Holly Dr
- Lot 17-1 Howland's Ln
- 24 Tremont St
- 6 Kingstown Way
- 10 Emily Ln
- 48 Grove St
- 484 Country Club Way
- 94 Buckboard Rd
- 70 Parks St Unit 18
- 40 Bay Farm Rd Unit 40
- 80 Parks St Unit 6
- 100 Parks St Unit 32