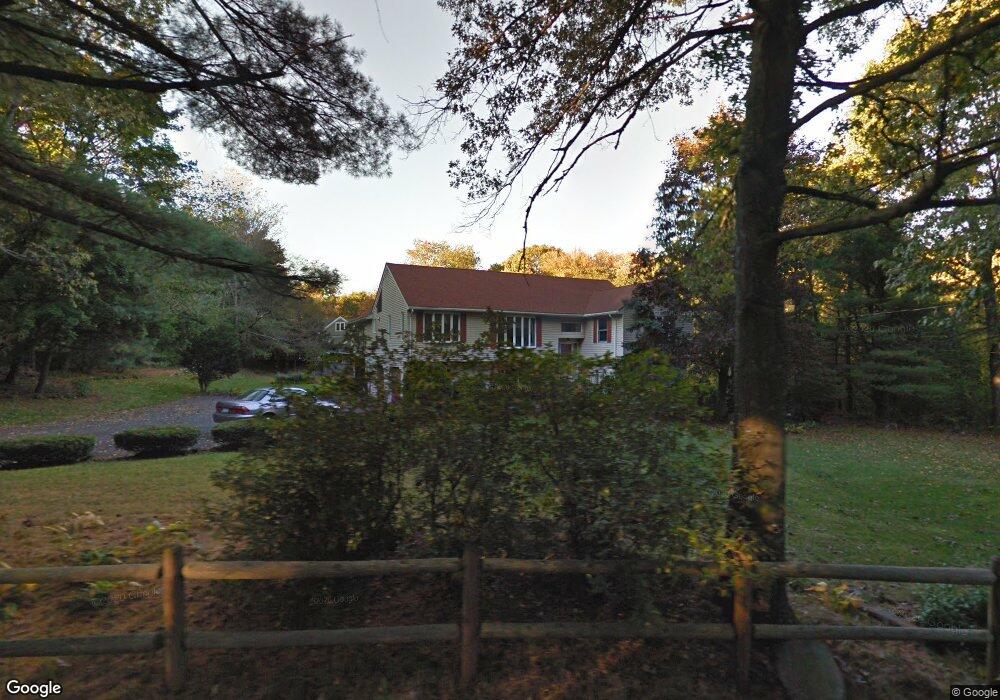
91 High Rock St Needham, MA 02492
Estimated Value: $1,494,000 - $1,987,267
5
Beds
3
Baths
3,300
Sq Ft
$537/Sq Ft
Est. Value
About This Home
This home is located at 91 High Rock St, Needham, MA 02492 and is currently estimated at $1,772,567, approximately $537 per square foot. 91 High Rock St is a home located in Norfolk County with nearby schools including Newman Elementary School, High Rock Middle School, and Pollard Middle School.
Ownership History
Date
Name
Owned For
Owner Type
Purchase Details
Closed on
Aug 29, 1996
Sold by
Hasenfus Charles K and Hasenfus Linda C
Bought by
Lai Peter So and Lai Judy Yn
Current Estimated Value
Home Financials for this Owner
Home Financials are based on the most recent Mortgage that was taken out on this home.
Original Mortgage
$207,000
Interest Rate
8.18%
Mortgage Type
Purchase Money Mortgage
Purchase Details
Closed on
Jul 6, 1994
Sold by
Hartman Alan G
Bought by
Hasenfus Bldrs Inc
Home Financials for this Owner
Home Financials are based on the most recent Mortgage that was taken out on this home.
Original Mortgage
$385,000
Interest Rate
8.51%
Mortgage Type
Purchase Money Mortgage
Create a Home Valuation Report for This Property
The Home Valuation Report is an in-depth analysis detailing your home's value as well as a comparison with similar homes in the area
Home Values in the Area
Average Home Value in this Area
Purchase History
| Date | Buyer | Sale Price | Title Company |
|---|---|---|---|
| Lai Peter So | $420,000 | -- | |
| Hasenfus Bldrs Inc | $275,000 | -- |
Source: Public Records
Mortgage History
| Date | Status | Borrower | Loan Amount |
|---|---|---|---|
| Open | Hasenfus Bldrs Inc | $200,000 | |
| Closed | Hasenfus Bldrs Inc | $207,000 | |
| Previous Owner | Hasenfus Bldrs Inc | $385,000 |
Source: Public Records
Tax History
| Year | Tax Paid | Tax Assessment Tax Assessment Total Assessment is a certain percentage of the fair market value that is determined by local assessors to be the total taxable value of land and additions on the property. | Land | Improvement |
|---|---|---|---|---|
| 2025 | $15,691 | $1,480,300 | $897,100 | $583,200 |
| 2024 | $14,974 | $1,196,000 | $700,800 | $495,200 |
| 2023 | $15,108 | $1,158,600 | $700,800 | $457,800 |
| 2022 | $14,898 | $1,114,300 | $700,800 | $413,500 |
| 2021 | $14,519 | $1,114,300 | $700,800 | $413,500 |
| 2020 | $14,205 | $1,137,300 | $700,700 | $436,600 |
| 2019 | $13,985 | $1,128,700 | $700,700 | $428,000 |
| 2018 | $13,409 | $1,128,700 | $700,700 | $428,000 |
| 2017 | $12,436 | $1,045,900 | $700,700 | $345,200 |
| 2016 | $12,114 | $1,049,700 | $700,700 | $349,000 |
| 2015 | $11,851 | $1,049,700 | $700,700 | $349,000 |
| 2014 | $12,052 | $1,035,400 | $700,700 | $334,700 |
Source: Public Records
Map
Nearby Homes
- 47 Emerson Rd
- 90 Norfolk St
- 53 Heather Ln
- 287 High Rock St
- 1011 Webster St
- 957 South St
- 68 Pleasant St Unit 68
- 233 Warren St
- 24 Deerfield Rd
- 26 Gordon Rd
- 73 Maple St Unit 1
- 95 Deerfield Rd
- 26 Pinewood Rd
- 193 Garden St
- 40 Otis St Unit L
- 19 Highland Ct Unit 19
- 620 High Rock St
- 1266 South St
- 189 Bridle Trail Rd
- 638 Webster St
- 103 High Rock St
- 71 Lantern Ln
- 27 Fletcher Rd
- 75 High Rock St
- 73 High Rock St
- 111 High Rock St
- 92 High Rock St
- 84 High Rock St
- 115 High Rock St
- 104 High Rock St
- 23 Fletcher Rd
- 30 Fletcher Rd
- 72 High Rock St
- 120 High Rock St
- 60 Lantern Ln
- 60 Lantern Ln Unit 2
- 15 Fletcher Rd
- 55 Lantern Ln
- 64 High Rock St
- 129 High Rock St
Your Personal Tour Guide
Ask me questions while you tour the home.