Estimated Value: $222,000 - $244,000
2
Beds
2
Baths
1,365
Sq Ft
$173/Sq Ft
Est. Value
About This Home
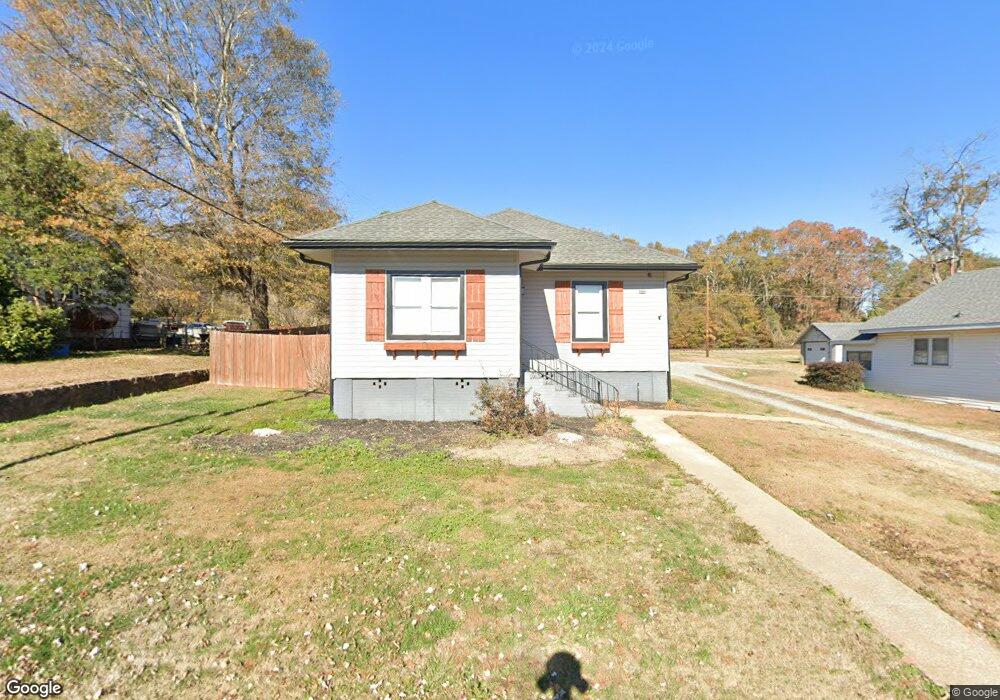
This home is located at 91 Lawrence St Unit A, Lyman, SC 29365 and is currently estimated at $235,590, approximately $172 per square foot. 91 Lawrence St Unit A is a home located in Spartanburg County with nearby schools including James Byrnes Freshman Academy, Beech Springs Intermediate School, and James F. Byrnes High School.
Ownership History
Date
Name
Owned For
Owner Type
Purchase Details
Closed on
May 16, 2022
Sold by
Kay Rutland Vonda
Bought by
Vonda K Rutland Revocable Trust
Current Estimated Value
Purchase Details
Closed on
Mar 11, 2022
Sold by
Delano Ledford Bobby
Bought by
Rutland Vonda Kay
Purchase Details
Closed on
Nov 22, 2017
Sold by
Allen Joshua B
Bought by
Ledford Bobby Delano and Ledford Tina Smith
Purchase Details
Closed on
Nov 10, 2017
Sold by
Allen Joshua B
Bought by
Ledford Bobby Delano and Ledford Tina Smith
Purchase Details
Closed on
Jun 20, 2007
Sold by
Turner Ronald A and Turner Ronald A
Bought by
Allen Joshua B
Home Financials for this Owner
Home Financials are based on the most recent Mortgage that was taken out on this home.
Original Mortgage
$85,000
Interest Rate
6.35%
Mortgage Type
Purchase Money Mortgage
Create a Home Valuation Report for This Property
The Home Valuation Report is an in-depth analysis detailing your home's value as well as a comparison with similar homes in the area
Home Values in the Area
Average Home Value in this Area
Purchase History
| Date | Buyer | Sale Price | Title Company |
|---|---|---|---|
| Vonda K Rutland Revocable Trust | $5,769 | Anderson Law Firm | |
| Vonda K Rutland Revocable Trust | $5,769 | Anderson Law Firm | |
| Rutland Vonda Kay | $225,000 | Anderson Law Firm | |
| Rutland Vonda Kay | $225,000 | Anderson Law Firm | |
| Ledford Bobby Delano | -- | None Available | |
| Ledford Bobby Delano | -- | None Available | |
| Allen Joshua B | $85,000 | Jasmine Title Agency Llc |
Source: Public Records
Mortgage History
| Date | Status | Borrower | Loan Amount |
|---|---|---|---|
| Previous Owner | Allen Joshua B | $85,000 |
Source: Public Records
Tax History Compared to Growth
Tax History
| Year | Tax Paid | Tax Assessment Tax Assessment Total Assessment is a certain percentage of the fair market value that is determined by local assessors to be the total taxable value of land and additions on the property. | Land | Improvement |
|---|---|---|---|---|
| 2025 | $1,516 | $9,000 | $1,012 | $7,988 |
| 2024 | $1,516 | $9,000 | $1,012 | $7,988 |
| 2023 | $1,516 | $9,000 | $1,012 | $7,988 |
| 2022 | $656 | $4,852 | $640 | $4,212 |
| 2021 | $1,072 | $4,852 | $640 | $4,212 |
| 2020 | $3,124 | $7,278 | $960 | $6,318 |
| 2019 | $3,121 | $7,278 | $960 | $6,318 |
| 2018 | $3,069 | $7,278 | $960 | $6,318 |
| 2017 | $2,475 | $5,790 | $900 | $4,890 |
| 2016 | $2,447 | $5,790 | $900 | $4,890 |
| 2015 | $791 | $3,860 | $600 | $3,260 |
| 2014 | $741 | $3,604 | $600 | $3,004 |
Source: Public Records
Map
Nearby Homes