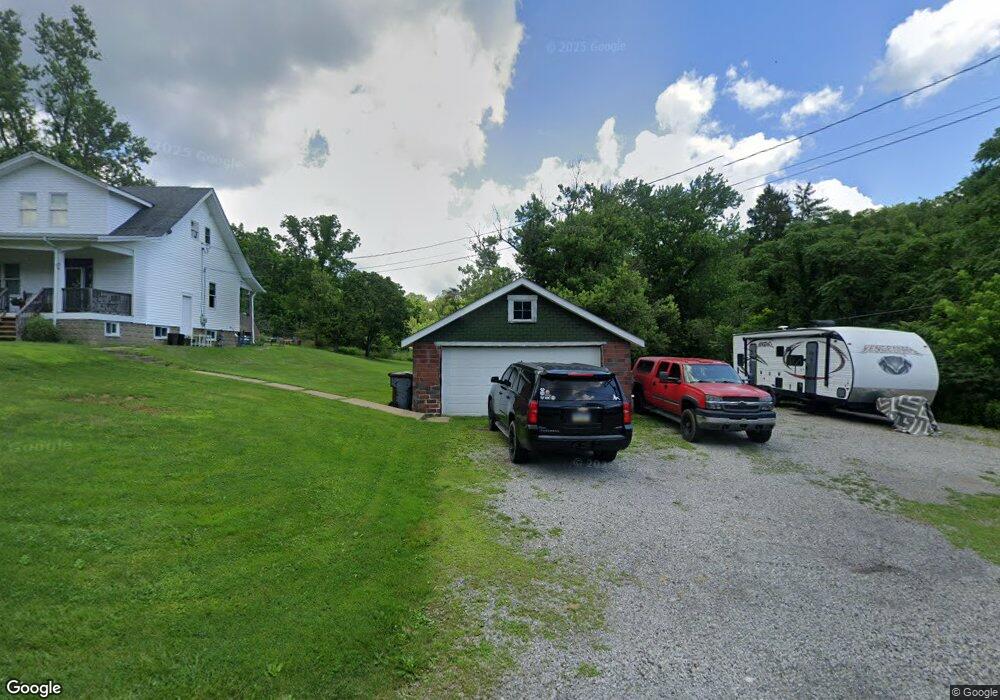
91 Millerstown Culmerville Rd Tarentum, PA 15084
West Deer Township NeighborhoodEstimated Value: $109,000 - $287,000
2
Beds
1
Bath
1,142
Sq Ft
$159/Sq Ft
Est. Value
About This Home
This home is located at 91 Millerstown Culmerville Rd, Tarentum, PA 15084 and is currently estimated at $182,023, approximately $159 per square foot. 91 Millerstown Culmerville Rd is a home located in Allegheny County with nearby schools including Curtisville Pri Center, East Union Intrmd School, and Deer Lakes Middle School.
Ownership History
Date
Name
Owned For
Owner Type
Purchase Details
Closed on
Oct 24, 2012
Sold by
Edinger George
Bought by
Wetzel Joseph J and Wolff Steven T
Current Estimated Value
Home Financials for this Owner
Home Financials are based on the most recent Mortgage that was taken out on this home.
Original Mortgage
$149,737
Outstanding Balance
$102,410
Interest Rate
3.25%
Mortgage Type
FHA
Estimated Equity
$79,613
Purchase Details
Closed on
Mar 17, 2010
Sold by
Fannie Mae
Bought by
Edinger George
Purchase Details
Closed on
Jun 2, 2008
Sold by
Kelly Michael T
Bought by
Fannie Mae Foundation
Purchase Details
Closed on
Aug 29, 2000
Sold by
Knoch Ethel Susanna
Bought by
Kelly Michael T
Purchase Details
Closed on
Sep 5, 1995
Sold by
Knoch Ethel Susanna
Bought by
Knoch Ethel Susanna and Donofrio Phyllis June
Create a Home Valuation Report for This Property
The Home Valuation Report is an in-depth analysis detailing your home's value as well as a comparison with similar homes in the area
Home Values in the Area
Average Home Value in this Area
Purchase History
| Date | Buyer | Sale Price | Title Company |
|---|---|---|---|
| Wetzel Joseph J | $152,500 | -- | |
| Edinger George | $40,000 | -- | |
| Fannie Mae Foundation | $2,647 | -- | |
| Kelly Michael T | $30,000 | -- | |
| Knoch Ethel Susanna | -- | -- |
Source: Public Records
Mortgage History
| Date | Status | Borrower | Loan Amount |
|---|---|---|---|
| Open | Wetzel Joseph J | $149,737 |
Source: Public Records
Tax History Compared to Growth
Tax History
| Year | Tax Paid | Tax Assessment Tax Assessment Total Assessment is a certain percentage of the fair market value that is determined by local assessors to be the total taxable value of land and additions on the property. | Land | Improvement |
|---|---|---|---|---|
| 2025 | $2,195 | $72,400 | $23,500 | $48,900 |
| 2024 | $2,202 | $72,400 | $23,500 | $48,900 |
| 2023 | $2,202 | $72,400 | $23,500 | $48,900 |
| 2022 | $2,202 | $72,400 | $23,500 | $48,900 |
| 2021 | $342 | $72,400 | $23,500 | $48,900 |
| 2020 | $2,148 | $72,400 | $23,500 | $48,900 |
| 2019 | $2,148 | $72,400 | $23,500 | $48,900 |
| 2018 | $342 | $72,400 | $23,500 | $48,900 |
| 2017 | $2,682 | $90,400 | $23,500 | $66,900 |
| 2016 | $428 | $90,400 | $23,500 | $66,900 |
| 2015 | $428 | $90,400 | $23,500 | $66,900 |
| 2014 | -- | $90,400 | $23,500 | $66,900 |
Source: Public Records
Map
Nearby Homes
- 49 Tarentum Culmerville Rd
- 27 Skyline Dr
- 89 Ford St
- 0 Snyder St
- 1772 Saxonburg Blvd
- 1122 Lardintown Rd
- 109 New Orchard Dr
- 1080A Saxonburg Blvd
- 124 Miller Dr
- 161 Mason Rd
- 1214 Sandstone Ct E
- 1204 Sun Mine Rd
- 0 Lot 10 Ashley Rd
- 529 Dana Dr
- 502 Bairdford Rd
- 20 Oak St Unit 18
- 1307 Player Way Unit 1307
- 468 Bairdford Rd
- 0 Bakerstown Rd
- 60 Greenleaf Dr
- 91 Millerstown Culmervi
- 87 Millerstown Culmerville Rd
- 92 Millerstown Culmerville Rd
- 88 Millerstown Culmerville Rd
- 81 Millerstown Culmerville Rd
- 96 Millerstown Culmerville Rd
- 96 Millerstown-Culmervi
- 107 Millerstown Culmerville Rd
- 105 Millerstown Culmerville Rd
- 108 Millerstown Culmerville Rd
- 83 Millerstown Culmerville Rd
- 94 Millerstown Culmerville Rd
- 24 Spring Ln
- 69 Millerstown Culmerville Rd
- 72 Millerstown Culmerville Rd
- 100 Millerstown Culmerville Rd
- 113 Millerstown Culmerville Rd
- 126 Millerstown Culmervi
- 126 Millerstown-Culmervi
- 126 Millerstown- Culmerv