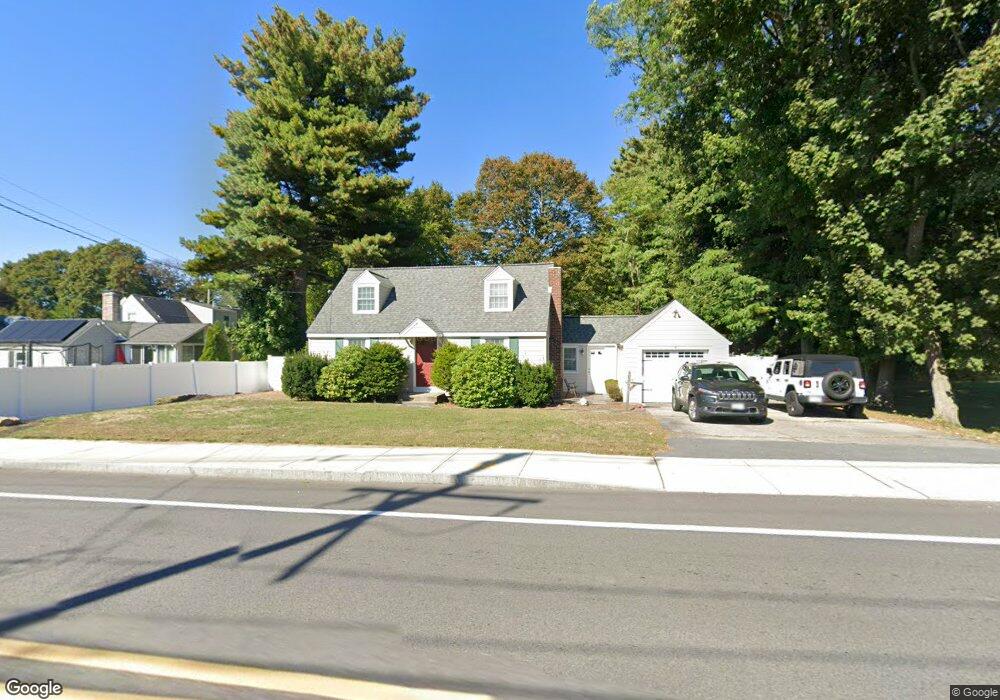
91 N Main St Natick, MA 01760
Estimated Value: $689,185 - $742,000
4
Beds
1
Bath
1,290
Sq Ft
$556/Sq Ft
Est. Value
About This Home
This home is located at 91 N Main St, Natick, MA 01760 and is currently estimated at $716,796, approximately $555 per square foot. 91 N Main St is a home located in Middlesex County with nearby schools including Natick High School, Wilson Middle School, and Bennett-Hemenway (Ben-Hem) Elementary School.
Ownership History
Date
Name
Owned For
Owner Type
Purchase Details
Closed on
Nov 18, 2015
Sold by
Nix Donald E and Nix Chris A
Bought by
Nix Ft
Current Estimated Value
Purchase Details
Closed on
Oct 26, 1990
Sold by
Paulini John S
Bought by
Nix Donald E
Home Financials for this Owner
Home Financials are based on the most recent Mortgage that was taken out on this home.
Original Mortgage
$1,315
Interest Rate
10.08%
Mortgage Type
Purchase Money Mortgage
Create a Home Valuation Report for This Property
The Home Valuation Report is an in-depth analysis detailing your home's value as well as a comparison with similar homes in the area
Home Values in the Area
Average Home Value in this Area
Purchase History
| Date | Buyer | Sale Price | Title Company |
|---|---|---|---|
| Nix Ft | -- | -- | |
| Nix Donald E | $148,000 | -- |
Source: Public Records
Mortgage History
| Date | Status | Borrower | Loan Amount |
|---|---|---|---|
| Previous Owner | Nix Donald E | $20,000 | |
| Previous Owner | Nix Donald E | $150,400 | |
| Previous Owner | Nix Donald E | $1,315 | |
| Previous Owner | Nix Donald E | $99,000 |
Source: Public Records
Tax History
| Year | Tax Paid | Tax Assessment Tax Assessment Total Assessment is a certain percentage of the fair market value that is determined by local assessors to be the total taxable value of land and additions on the property. | Land | Improvement |
|---|---|---|---|---|
| 2025 | $6,994 | $584,800 | $385,100 | $199,700 |
| 2024 | $6,759 | $551,300 | $362,500 | $188,800 |
| 2023 | $6,752 | $534,200 | $348,700 | $185,500 |
| 2022 | $6,586 | $493,700 | $316,700 | $177,000 |
| 2021 | $6,341 | $465,900 | $298,600 | $167,300 |
| 2020 | $6,157 | $452,400 | $285,100 | $167,300 |
| 2019 | $5,750 | $452,400 | $285,100 | $167,300 |
| 2018 | $5,422 | $415,500 | $271,500 | $144,000 |
| 2017 | $5,152 | $381,900 | $240,400 | $141,500 |
| 2016 | $4,980 | $367,000 | $226,900 | $140,100 |
| 2015 | $4,919 | $355,900 | $226,900 | $129,000 |
Source: Public Records
Map
Nearby Homes
- 41 Charles St
- 36 Winnemay St
- 9 Bellevue Rd
- 7 Jackson Ct Unit B
- 27 2nd St
- 20 Florence St Unit B
- 16 Harvard St
- 49 Summer St
- 17 Florence St
- 142 Bacon St
- 89 W Central St
- 63 Pond St
- 293 Bacon St Unit A
- 3 Wilson St Unit 3B
- 3 Vale St Unit A
- 4B Lincoln St Unit 4B
- 53 Harvard Street Extension
- 6A Lincoln St Unit 6A
- 3A Wilson St Unit 3A
- 5 Reynolds Ave Unit 2
Your Personal Tour Guide
Ask me questions while you tour the home.