K
Seller's Agent in 2025
Kelleher - Pentore Team
Horvath & Tremblay
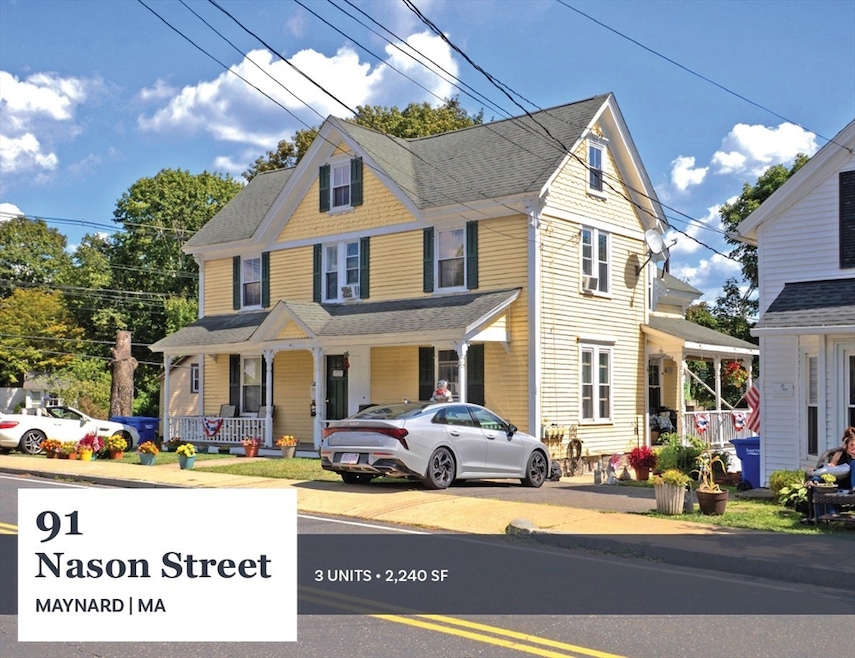
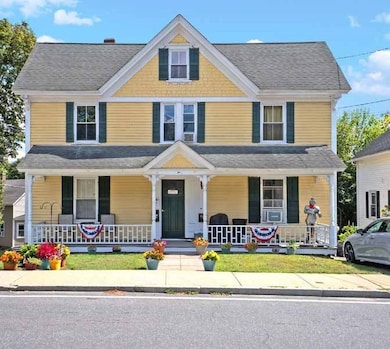
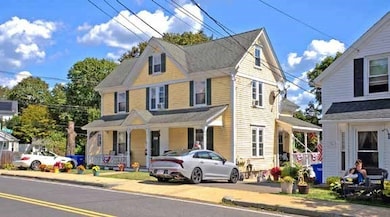
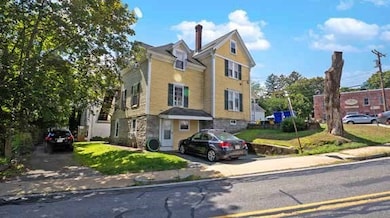
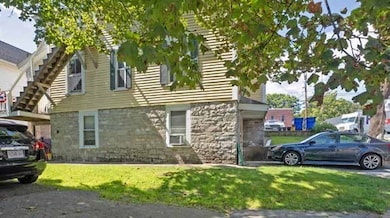
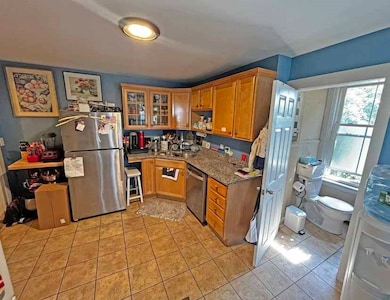
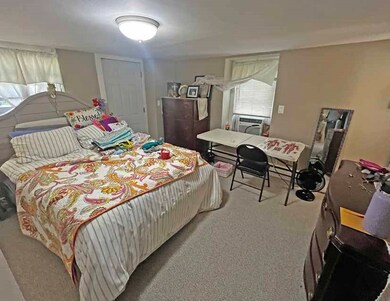
91 Nason St is a three-story residential building containing three (3) units consisting of one (1), 1-Bedroom/1-Bathroom unit and two (2), 2-Bedroom/1-Bathroom units. The Property has undergone recent updates within the past year. These recent capital improvements include the installation of one new boiler, brand-new interior carpeting throughout all units, and updates to 2 of the 3 unit interiors. Amenities include five (5) off-street parking spaces and on-site laundry in the basement. Tenants pay for their electricity and gas-fired heat and hot water directly, with the landlord only responsible for common area electric and domestic water and sewer. 91 Nason Street offers the ability to acquire a well-maintained, updated building in an exceptional location.
Last Agent to Sell the Property
Kelleher - Pentore Team
Horvath & Tremblay Listed on: 09/18/2025
Last Buyer's Agent
Kelleher - Pentore Team
Horvath & Tremblay Listed on: 09/18/2025
| Date | Type | Sale Price | Title Company |
|---|---|---|---|
| Quit Claim Deed | $615,000 | -- | |
| Quit Claim Deed | -- | None Available | |
| Quit Claim Deed | -- | None Available | |
| Deed | -- | -- | |
| Deed | -- | -- | |
| Quit Claim Deed | $404,625 | -- | |
| Quit Claim Deed | $404,625 | -- |
| Date | Status | Loan Amount | Loan Type |
|---|---|---|---|
| Open | $522,750 | New Conventional | |
| Previous Owner | $303,469 | New Conventional |
| Date | Event | Price | List to Sale | Price per Sq Ft |
|---|---|---|---|---|
| 12/19/2025 12/19/25 | Sold | $615,000 | -5.4% | $275 / Sq Ft |
| 11/03/2025 11/03/25 | Pending | -- | -- | -- |
| 10/13/2025 10/13/25 | For Sale | $650,000 | 0.0% | $290 / Sq Ft |
| 09/29/2025 09/29/25 | Pending | -- | -- | -- |
| 09/18/2025 09/18/25 | For Sale | $650,000 | -- | $290 / Sq Ft |
| Year | Tax Paid | Tax Assessment Tax Assessment Total Assessment is a certain percentage of the fair market value that is determined by local assessors to be the total taxable value of land and additions on the property. | Land | Improvement |
|---|---|---|---|---|
| 2025 | $8,999 | $504,700 | $262,900 | $241,800 |
| 2024 | $8,801 | $492,200 | $250,400 | $241,800 |
| 2023 | $8,853 | $466,700 | $238,500 | $228,200 |
| 2022 | $8,793 | $428,500 | $200,300 | $228,200 |
| 2021 | $8,441 | $418,900 | $200,300 | $218,600 |
| 2020 | $8,239 | $399,200 | $181,300 | $217,900 |
| 2019 | $7,621 | $362,200 | $173,200 | $189,000 |
| 2018 | $6,353 | $280,600 | $157,400 | $123,200 |
| 2017 | $6,176 | $280,600 | $157,400 | $123,200 |
| 2016 | $5,963 | $280,600 | $157,400 | $123,200 |
| 2015 | $6,267 | $280,900 | $150,300 | $130,600 |
| 2014 | $6,348 | $284,800 | $145,500 | $139,300 |
K
Seller's Agent in 2025
Kelleher - Pentore Team
Horvath & Tremblay

Seller Co-Listing Agent in 2025
Dennis Kelleher
Horvath & Tremblay
(781) 776-4002
2 in this area
63 Total Sales
Source: MLS Property Information Network (MLS PIN)
MLS Number: 73432916
APN: MAYN-000014-000000-000226
Disclaimer: Certain information contained herein is derived from information provided by parties other than Homes.com. All information provided is deemed reliable, but is not guaranteed to be accurate and should be independently verified.
![]() The property listing data and information, or the Images, set forth herein were provided to MLS Property Information Network, Inc. from third party sources, including sellers, lessors and public records, and were compiled by MLS Property Information Network, Inc. The property listing data and information, and the Images, are for the personal, non-commercial use of consumers having a good faith interest in purchasing or leasing listed properties of the type displayed to them and may not be used for any purpose other than to identify prospective properties which such consumers may have a good faith interest in purchasing or leasing. MLS Property Information Network, Inc. and its subscribers disclaim any and all representations and warranties as to the accuracy of the property listing data and information, or as to the accuracy of any of the Images, set forth herein.
The property listing data and information, or the Images, set forth herein were provided to MLS Property Information Network, Inc. from third party sources, including sellers, lessors and public records, and were compiled by MLS Property Information Network, Inc. The property listing data and information, and the Images, are for the personal, non-commercial use of consumers having a good faith interest in purchasing or leasing listed properties of the type displayed to them and may not be used for any purpose other than to identify prospective properties which such consumers may have a good faith interest in purchasing or leasing. MLS Property Information Network, Inc. and its subscribers disclaim any and all representations and warranties as to the accuracy of the property listing data and information, or as to the accuracy of any of the Images, set forth herein.
Ask me questions while you tour the home.