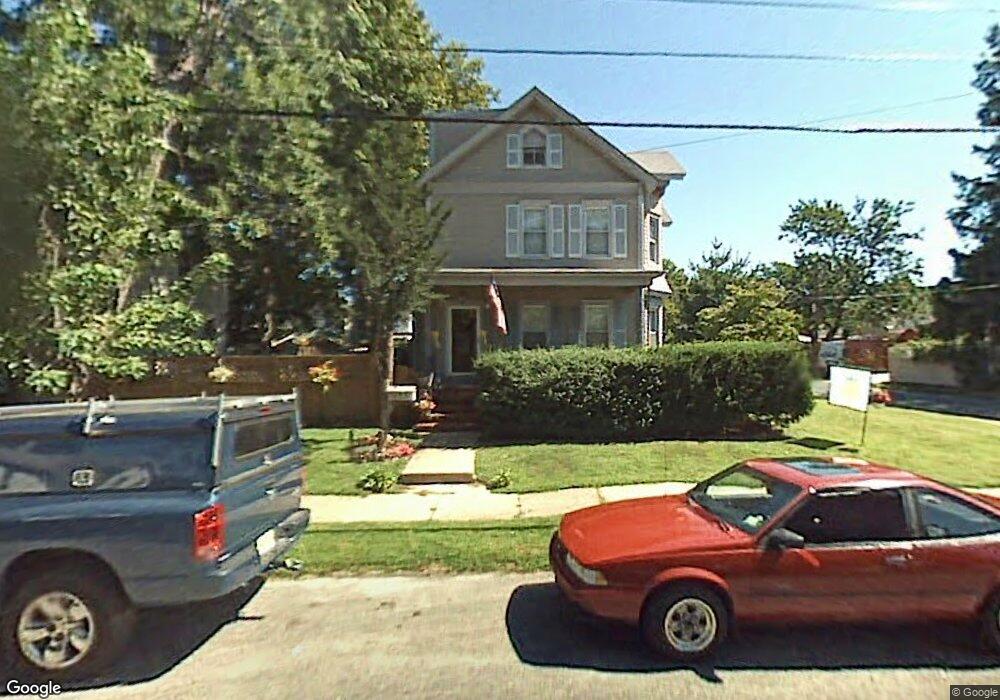
91 Osborn St Keyport, NJ 07735
Estimated Value: $562,227 - $636,000
3
Beds
1
Bath
1,852
Sq Ft
$329/Sq Ft
Est. Value
About This Home
This home is located at 91 Osborn St, Keyport, NJ 07735 and is currently estimated at $608,807, approximately $328 per square foot. 91 Osborn St is a home located in Monmouth County with nearby schools including Keyport Central School, Keyport High School, and Icob Academy.
Ownership History
Date
Name
Owned For
Owner Type
Purchase Details
Closed on
Jan 15, 2020
Sold by
Natarcola Theresa Ann
Bought by
Natarcola Louis and Natarola Theresa Ann
Current Estimated Value
Purchase Details
Closed on
Nov 21, 2017
Sold by
Natarcola Louis and Natarcola Theresa Ann
Bought by
Natarcola Theresa Ann
Create a Home Valuation Report for This Property
The Home Valuation Report is an in-depth analysis detailing your home's value as well as a comparison with similar homes in the area
Home Values in the Area
Average Home Value in this Area
Purchase History
| Date | Buyer | Sale Price | Title Company |
|---|---|---|---|
| Natarcola Louis | -- | None Available | |
| Natarcola Theresa Ann | -- | -- |
Source: Public Records
Tax History Compared to Growth
Tax History
| Year | Tax Paid | Tax Assessment Tax Assessment Total Assessment is a certain percentage of the fair market value that is determined by local assessors to be the total taxable value of land and additions on the property. | Land | Improvement |
|---|---|---|---|---|
| 2025 | $9,332 | $497,000 | $233,000 | $264,000 |
| 2024 | $9,203 | $450,800 | $199,800 | $251,000 |
| 2023 | $9,203 | $418,700 | $181,700 | $237,000 |
| 2022 | $8,337 | $364,000 | $158,000 | $206,000 |
| 2021 | $8,337 | $330,300 | $146,300 | $184,000 |
| 2020 | $8,036 | $316,000 | $141,000 | $175,000 |
| 2019 | $7,795 | $307,000 | $136,000 | $171,000 |
| 2018 | $7,930 | $305,000 | $145,000 | $160,000 |
| 2017 | $7,769 | $298,000 | $140,000 | $158,000 |
| 2016 | $7,497 | $290,000 | $140,000 | $150,000 |
| 2015 | $7,090 | $273,000 | $125,000 | $148,000 |
| 2014 | $6,474 | $251,700 | $100,000 | $151,700 |
Source: Public Records
Map
Nearby Homes