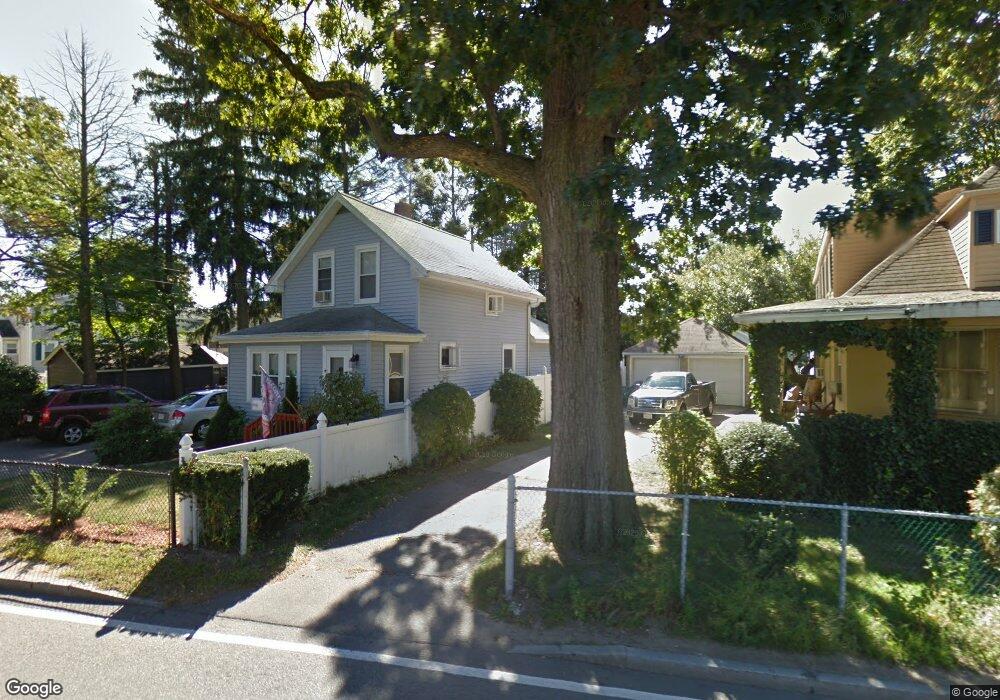
91 Palmer St Quincy, MA 02169
Adams Shore NeighborhoodEstimated Value: $752,000 - $870,588
1
Bed
1
Bath
2,735
Sq Ft
$304/Sq Ft
Est. Value
About This Home
This home is located at 91 Palmer St, Quincy, MA 02169 and is currently estimated at $830,147, approximately $303 per square foot. 91 Palmer St is a home located in Norfolk County with nearby schools including Snug Harbor Community School, Broad Meadows Middle School, and Quincy High School.
Ownership History
Date
Name
Owned For
Owner Type
Purchase Details
Closed on
Aug 31, 2018
Sold by
Darrow Harold C Est
Bought by
Nguyen Cuong H and Phan Khuong
Current Estimated Value
Home Financials for this Owner
Home Financials are based on the most recent Mortgage that was taken out on this home.
Original Mortgage
$336,000
Outstanding Balance
$292,408
Interest Rate
4.5%
Mortgage Type
New Conventional
Estimated Equity
$537,739
Purchase Details
Closed on
May 14, 2018
Sold by
Lynch Marybeth and Lynch Brian S
Bought by
Lynch Jennifer P
Purchase Details
Closed on
Nov 8, 1968
Bought by
Darrow Harold C
Create a Home Valuation Report for This Property
The Home Valuation Report is an in-depth analysis detailing your home's value as well as a comparison with similar homes in the area
Home Values in the Area
Average Home Value in this Area
Purchase History
| Date | Buyer | Sale Price | Title Company |
|---|---|---|---|
| Nguyen Cuong H | $420,000 | -- | |
| Lynch Jennifer P | -- | -- | |
| Darrow Harold C | -- | -- |
Source: Public Records
Mortgage History
| Date | Status | Borrower | Loan Amount |
|---|---|---|---|
| Open | Nguyen Cuong H | $336,000 |
Source: Public Records
Tax History Compared to Growth
Tax History
| Year | Tax Paid | Tax Assessment Tax Assessment Total Assessment is a certain percentage of the fair market value that is determined by local assessors to be the total taxable value of land and additions on the property. | Land | Improvement |
|---|---|---|---|---|
| 2025 | $9,965 | $864,300 | $248,100 | $616,200 |
| 2024 | $8,774 | $778,500 | $248,100 | $530,400 |
| 2023 | $5,998 | $538,900 | $225,600 | $313,300 |
| 2022 | $5,927 | $494,700 | $173,900 | $320,800 |
| 2021 | $5,285 | $435,300 | $151,400 | $283,900 |
| 2020 | $5,510 | $443,300 | $168,100 | $275,200 |
| 2019 | $5,331 | $424,800 | $154,300 | $270,500 |
| 2018 | $5,215 | $390,900 | $147,100 | $243,800 |
| 2017 | $5,097 | $359,700 | $133,800 | $225,900 |
| 2016 | $5,119 | $356,500 | $148,500 | $208,000 |
| 2015 | $4,749 | $325,300 | $135,100 | $190,200 |
| 2014 | $4,363 | $293,600 | $123,000 | $170,600 |
Source: Public Records
Map
Nearby Homes
- 12 Quentin St
- 10 Forbush Ave
- 599 Sea St
- 599 Sea St Unit 1
- 503 Sea St
- 200 Cove Way Unit 614
- 73 Albatross Rd
- 18 Allerton St
- 7 Manet Ave
- 62 Lawn Ave
- 37 Hobomack Rd
- 585 Washington St Unit model-1
- 585 Washington St Unit model-2
- 585 Washington St Unit model
- 79 Bicknell St
- 7-11 Lenox St
- 16 Perley Place
- 82 Lenox St
- 966 Sea St
- 161 Sumner St Unit 2