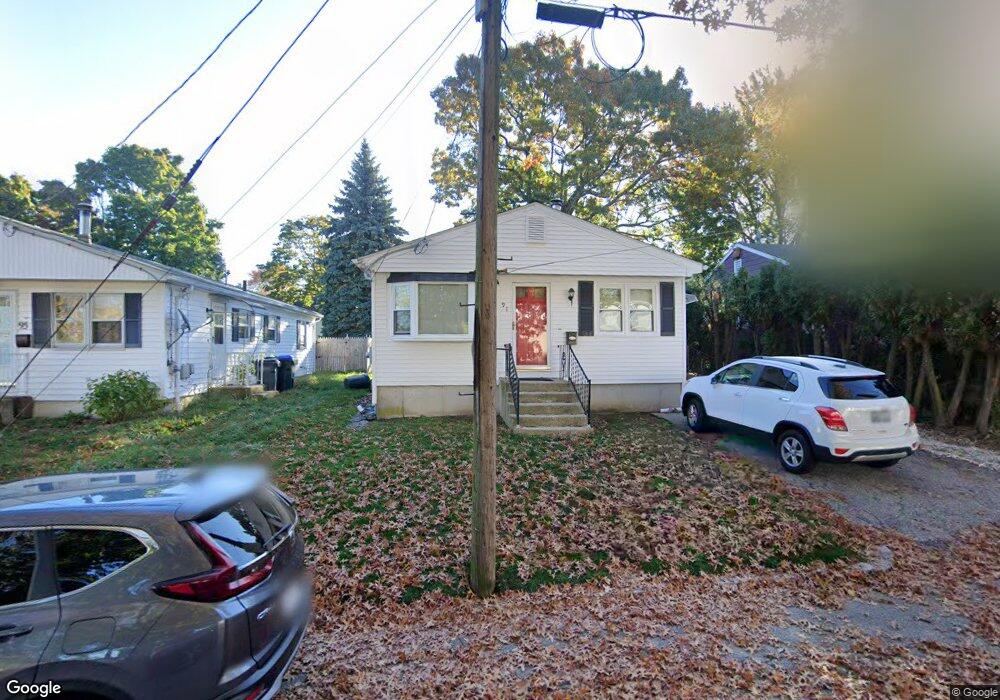
91 Phebe St Providence, RI 02904
Wanskuck NeighborhoodEstimated Value: $315,000 - $355,383
3
Beds
1
Bath
960
Sq Ft
$357/Sq Ft
Est. Value
About This Home
This home is located at 91 Phebe St, Providence, RI 02904 and is currently estimated at $342,346, approximately $356 per square foot. 91 Phebe St is a home located in Providence County with nearby schools including Asa Messer Elementary School, Charles N. Fortes Elementary School, and Veazie Street Elementary School.
Ownership History
Date
Name
Owned For
Owner Type
Purchase Details
Closed on
Feb 11, 2003
Sold by
Oneil Daniel
Bought by
Dent Valerie
Current Estimated Value
Purchase Details
Closed on
Oct 1, 2002
Sold by
Est Ventriglia Carmela and Moura Sulvia
Bought by
Oneil Daniel
Create a Home Valuation Report for This Property
The Home Valuation Report is an in-depth analysis detailing your home's value as well as a comparison with similar homes in the area
Home Values in the Area
Average Home Value in this Area
Purchase History
| Date | Buyer | Sale Price | Title Company |
|---|---|---|---|
| Dent Valerie | $120,000 | -- | |
| Oneil Daniel | $75,000 | -- |
Source: Public Records
Mortgage History
| Date | Status | Borrower | Loan Amount |
|---|---|---|---|
| Open | Oneil Daniel | $30,348 | |
| Closed | Oneil Daniel | $30,000 | |
| Open | Oneil Daniel | $160,000 | |
| Closed | Oneil Daniel | $123,000 |
Source: Public Records
Tax History Compared to Growth
Tax History
| Year | Tax Paid | Tax Assessment Tax Assessment Total Assessment is a certain percentage of the fair market value that is determined by local assessors to be the total taxable value of land and additions on the property. | Land | Improvement |
|---|---|---|---|---|
| 2025 | $2,719 | $323,700 | $163,000 | $160,700 |
| 2024 | $4,213 | $229,600 | $89,400 | $140,200 |
| 2023 | $4,213 | $229,600 | $89,400 | $140,200 |
| 2022 | $4,087 | $229,600 | $89,400 | $140,200 |
| 2021 | $3,512 | $143,000 | $45,400 | $97,600 |
| 2020 | $3,512 | $143,000 | $45,400 | $97,600 |
| 2019 | $3,512 | $143,000 | $45,400 | $97,600 |
| 2018 | $3,247 | $101,600 | $38,500 | $63,100 |
| 2017 | $3,247 | $101,600 | $38,500 | $63,100 |
| 2016 | $3,247 | $101,600 | $38,500 | $63,100 |
| 2015 | $3,098 | $93,600 | $38,500 | $55,100 |
| 2014 | $3,159 | $93,600 | $38,500 | $55,100 |
| 2013 | $3,159 | $93,600 | $38,500 | $55,100 |
Source: Public Records
Map
Nearby Homes
- 60 Hazael St
- 65 General St
- 22 General St
- 115 Hazael St
- 80 Lubec St
- 1014 Douglas Ave
- 31 Joseph St
- 507 Sharon St
- 39 Hillview Ave
- 1117 Douglas Ave Unit 115
- 0 Wainwright St
- 41 Henrietta St
- 73 Wainwright St
- 860 Douglas Ave
- 252 Gentian Ave
- 272 Veazie St
- 825 Douglas Ave
- 28 Mink Rd
- 874 Branch Ave
- 797 Academy Ave