91 Root Rd Westfield, MA 01085
Estimated Value: $374,000 - $515,000
About This Home
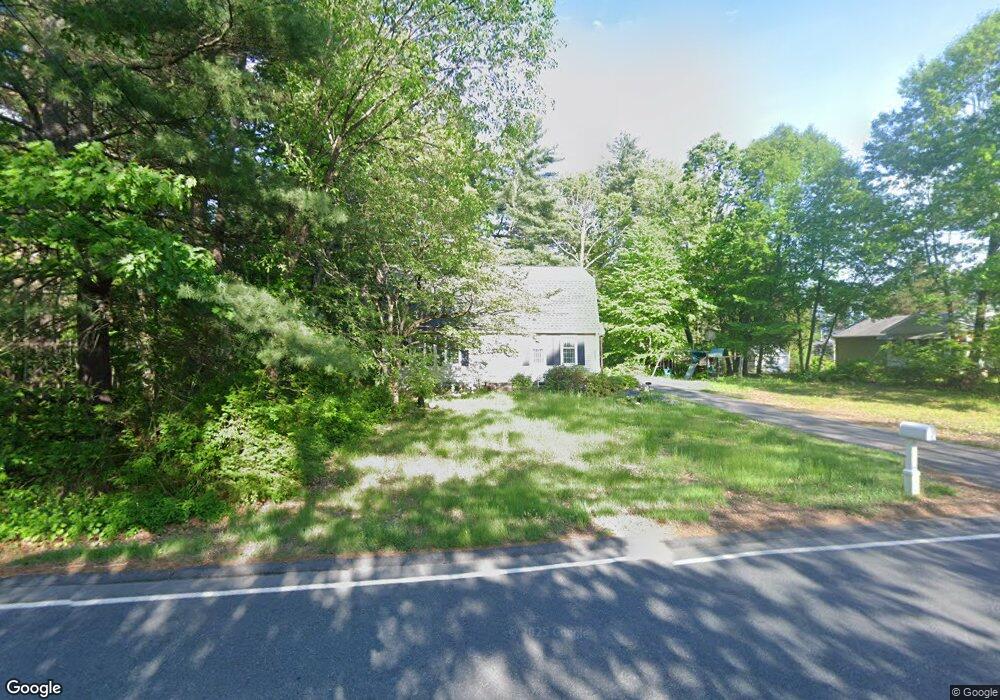
This home is located at 91 Root Rd, Westfield, MA 01085 and is currently estimated at $424,535, approximately $245 per square foot. 91 Root Rd is a home located in Hampden County with nearby schools including Westfield High School, White Oak School, and Saint Mary High School.
Ownership History
We collect this data history from publicly available records. To have your information removed, we recommend requesting removal directly through your county’s website.
Purchase Details
Home Financials for this Owner
Home Financials are based on the most recent Mortgage that was taken out on this home.Home Values in the Area
Average Home Value in this Area
Purchase History
We collect this data history from publicly available records. To have your information removed, we recommend requesting removal directly through your county’s website.
| Date | Buyer | Sale Price | Title Company |
|---|---|---|---|
| -- | -- |
Mortgage History
We collect this data history from publicly available records. To have your information removed, we recommend requesting removal directly through your county’s website.
| Date | Status | Borrower | Loan Amount |
|---|---|---|---|
| Closed | $148,470 | ||
| Closed | $122,000 | ||
| Closed | $87,546 | ||
| Closed | $30,000 |
Tax History
We collect this data history from publicly available records. To have your information removed, we recommend requesting removal directly through your county’s website.
| Year | Tax Paid | Tax Assessment Tax Assessment Total Assessment is a certain percentage of the fair market value that is determined by local assessors to be the total taxable value of land and additions on the property. | Land | Improvement |
|---|---|---|---|---|
| 2025 | $4,496 | $296,200 | $110,500 | $185,700 |
| 2024 | $4,464 | $279,500 | $100,500 | $179,000 |
| 2023 | $4,145 | $253,400 | $95,700 | $157,700 |
| 2022 | $4,145 | $224,200 | $85,200 | $139,000 |
| 2021 | $4,020 | $212,900 | $80,500 | $132,400 |
| 2020 | $4,043 | $210,000 | $80,500 | $129,500 |
| 2019 | $3,950 | $200,800 | $76,500 | $124,300 |
| 2018 | $3,887 | $200,800 | $76,500 | $124,300 |
| 2017 | $3,824 | $196,900 | $77,800 | $119,100 |
| 2016 | $3,828 | $196,900 | $77,800 | $119,100 |
| 2015 | $3,606 | $194,500 | $77,800 | $116,700 |
| 2014 | $2,696 | $194,500 | $77,800 | $116,700 |
Map
- 9 Johns Dr
- 21 4th Ave
- 5 4th Ave
- 16 Fair Ln
- 17 Russellville Rd
- 127 Freedom Trail
- 457 Montgomery Rd
- 868 Southampton Rd Unit 43
- 67 Woodside Terrace
- 110 Lockhouse Rd Unit I
- 10 Scenic Rd
- 37 Klondike Ave
- 38 Klondike Ave
- 36 Klondike Ave Unit Ave
- 8 Emerald Ave
- 35 Pinehurst St
- 96 Pine St
- 45 Skyline Dr
- 19 Arch Rd
- Lot 2 Nathaniel Hill
Ask me questions while you tour the home.