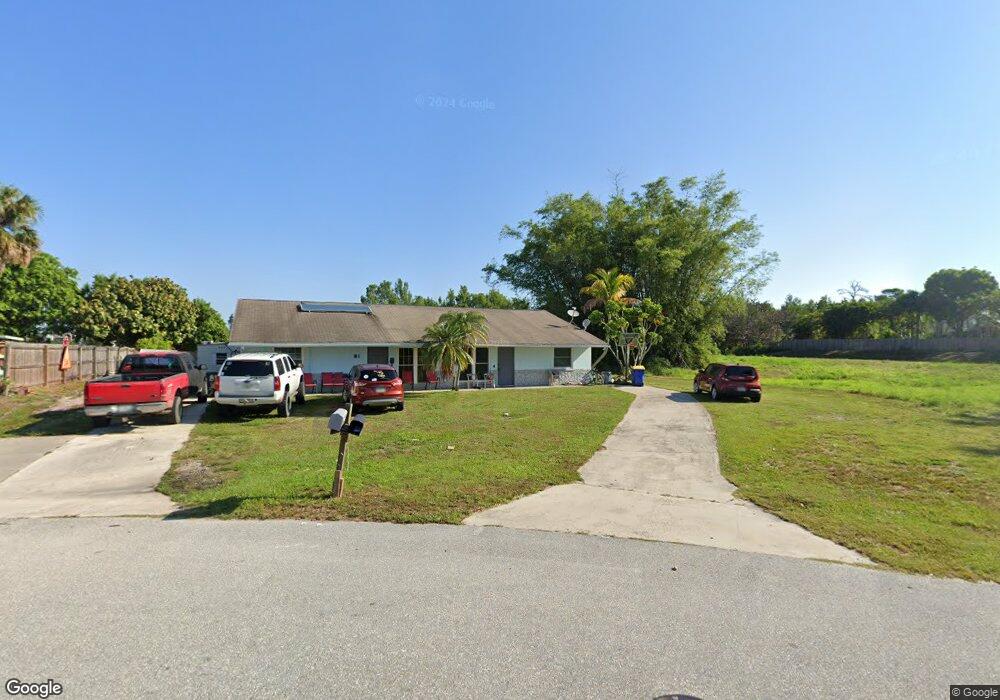
91 SE Cayuga Terrace Stuart, FL 34997
Willoughby NeighborhoodEstimated Value: $244,000 - $289,000
2
Beds
3
Baths
1,131
Sq Ft
$238/Sq Ft
Est. Value
About This Home
This home is located at 91 SE Cayuga Terrace, Stuart, FL 34997 and is currently estimated at $269,558, approximately $238 per square foot. 91 SE Cayuga Terrace is a home located in Martin County with nearby schools including Pinewood Elementary School, Dr. David L. Anderson Middle School, and Martin County High School.
Ownership History
Date
Name
Owned For
Owner Type
Purchase Details
Closed on
Aug 10, 2017
Sold by
Tumleweed Sc Llc
Bought by
Sandoz Melvin Pabon and Pabon Guadalupe
Current Estimated Value
Home Financials for this Owner
Home Financials are based on the most recent Mortgage that was taken out on this home.
Original Mortgage
$109,890
Outstanding Balance
$93,279
Interest Rate
4.62%
Mortgage Type
FHA
Estimated Equity
$176,279
Purchase Details
Closed on
Jul 30, 2010
Sold by
Cole Phyllis
Bought by
Tumbleweed Sc Llc
Purchase Details
Closed on
Jul 13, 2005
Sold by
Kehoe Phyllis Cole and Cole Phyllis
Bought by
Cole Phyllis
Purchase Details
Closed on
Apr 30, 2002
Sold by
Mulcahy Trenna P and Mulcahy Glenn E
Bought by
Kehoe Phyllis Cole
Home Financials for this Owner
Home Financials are based on the most recent Mortgage that was taken out on this home.
Original Mortgage
$102,000
Interest Rate
5.35%
Create a Home Valuation Report for This Property
The Home Valuation Report is an in-depth analysis detailing your home's value as well as a comparison with similar homes in the area
Home Values in the Area
Average Home Value in this Area
Purchase History
| Date | Buyer | Sale Price | Title Company |
|---|---|---|---|
| Sandoz Melvin Pabon | $118,000 | South Florida Title Svcs Inc | |
| Tumbleweed Sc Llc | $49,500 | Merit Title Inc | |
| Cole Phyllis | -- | -- | |
| Kehoe Phyllis Cole | $136,000 | Stewart Title Martin Cnty In |
Source: Public Records
Mortgage History
| Date | Status | Borrower | Loan Amount |
|---|---|---|---|
| Open | Sandoz Melvin Pabon | $109,890 | |
| Previous Owner | Kehoe Phyllis Cole | $102,000 |
Source: Public Records
Tax History
| Year | Tax Paid | Tax Assessment Tax Assessment Total Assessment is a certain percentage of the fair market value that is determined by local assessors to be the total taxable value of land and additions on the property. | Land | Improvement |
|---|---|---|---|---|
| 2025 | $3,554 | $103,188 | -- | -- |
| 2024 | $3,508 | $100,280 | -- | -- |
| 2023 | $3,508 | $97,360 | $0 | $0 |
| 2022 | $3,444 | $94,525 | $0 | $0 |
| 2021 | $3,421 | $91,772 | $0 | $0 |
| 2020 | $1,184 | $90,505 | $0 | $0 |
| 2019 | $1,162 | $88,470 | $0 | $0 |
| 2018 | $1,125 | $86,820 | $45,000 | $41,820 |
| 2017 | $1,064 | $75,530 | $40,000 | $35,530 |
| 2016 | $1,185 | $53,870 | $17,000 | $36,870 |
| 2015 | $972 | $49,710 | $11,500 | $38,210 |
| 2014 | $972 | $41,680 | $11,000 | $30,680 |
Source: Public Records
Map
Nearby Homes
- 4171 SE Geneva Dr
- 1052 SE Westminster Place
- 1039 SE Westminster Place
- 937 SE Westminster Place
- 75 SW Squirrel Nest Way
- 938 SE Westminster Place
- 926 SE Westminster Place
- 871 SE Westminster Place
- 211 SW South River Dr Unit 205
- 31 SW South River Dr Unit 106
- 1129 SE Westminster Place
- 208 SW Otter Run Place
- 233 SW Otter Run Place
- 241 SW South River Dr Unit 104
- 241 SW South River Dr Unit 206
- 252 SW Otter Run Place
- 330 SW South River Dr Unit 201
- 361 SW South River Dr Unit 103
- 960 SE Willoughby Trace Unit 960
- 301 SW South River Dr Unit 204
- 81 SE Cayuga Tc Terrace
- 81 SE Cayuga Terrace
- 71 SE Cayuga Terrace
- 4161 SE Geneva Dr
- 61 SE Cayuga Terrace
- 4170 SE Geneva Dr
- 51 SE Cayuga Terrace
- 4160 SE Geneva Dr
- 1004 SE Westminster Place
- 1010 SE Westminster Place
- 4181 SE Geneva Dr
- 41 SE Cayuga Terrace
- 1016 SE Westminster Place
- 52 SE Cayuga Terrace
- 998 SE Westminster Place
- 1022 SE Westminster Place
- 4191 SE Geneva Dr
- 31 SE Cayuga Terrace
- 31 SE Cayuga Tc