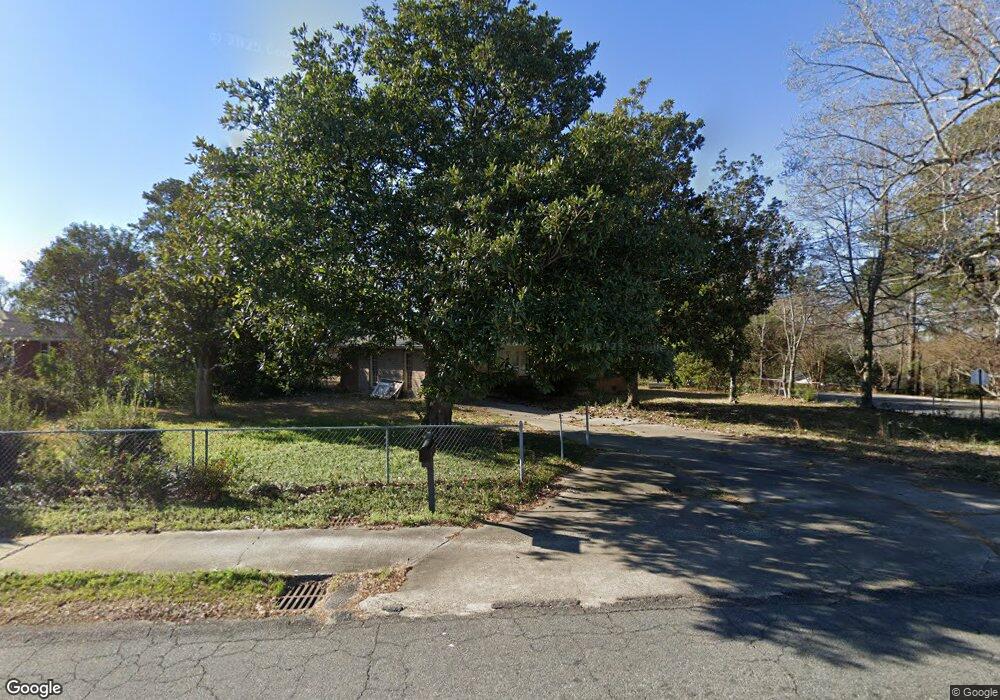
91 Sheridan Way Warner Robins, GA 31088
Estimated Value: $152,000 - $190,000
3
Beds
2
Baths
1,421
Sq Ft
$115/Sq Ft
Est. Value
About This Home
This home is located at 91 Sheridan Way, Warner Robins, GA 31088 and is currently estimated at $164,093, approximately $115 per square foot. 91 Sheridan Way is a home located in Houston County with nearby schools including Miller Elementary School, Warner Robins Middle School, and Warner Robins High School.
Ownership History
Date
Name
Owned For
Owner Type
Purchase Details
Closed on
Jun 4, 2024
Sold by
Tax Commissioner And Ex Officio Sheriff
Bought by
Peterson Daniela
Current Estimated Value
Purchase Details
Closed on
May 10, 2017
Sold by
The Bank Of New York Mellon
Bought by
Johnson David
Purchase Details
Closed on
Jan 3, 2017
Sold by
Rose M
Bought by
The Bank Of New York Mellon
Purchase Details
Closed on
Aug 30, 2002
Sold by
Rose Gail M Estate
Bought by
Rose Charles M
Purchase Details
Closed on
May 28, 1996
Sold by
Rose Charles M
Bought by
Rose Charles M and Gail M*
Purchase Details
Closed on
May 31, 1972
Sold by
Minick James Simpson
Bought by
Rose Charles M
Purchase Details
Closed on
Oct 10, 1968
Sold by
Griggs Nancy H
Bought by
Minick James Simpson
Purchase Details
Closed on
Oct 17, 1967
Sold by
Turner Harley O
Bought by
Griggs Nancy H
Purchase Details
Closed on
May 27, 1959
Bought by
Turner Harley O
Create a Home Valuation Report for This Property
The Home Valuation Report is an in-depth analysis detailing your home's value as well as a comparison with similar homes in the area
Home Values in the Area
Average Home Value in this Area
Purchase History
| Date | Buyer | Sale Price | Title Company |
|---|---|---|---|
| Peterson Daniela | $62,000 | None Listed On Document | |
| Johnson David | $34,784 | None Available | |
| The Bank Of New York Mellon | -- | -- | |
| Rose Charles M | -- | -- | |
| Rose Charles M | -- | -- | |
| Rose Charles M | -- | -- | |
| Minick James Simpson | -- | -- | |
| Griggs Nancy H | -- | -- | |
| Turner Harley O | -- | -- |
Source: Public Records
Tax History Compared to Growth
Tax History
| Year | Tax Paid | Tax Assessment Tax Assessment Total Assessment is a certain percentage of the fair market value that is determined by local assessors to be the total taxable value of land and additions on the property. | Land | Improvement |
|---|---|---|---|---|
| 2024 | $1,510 | $47,520 | $6,000 | $41,520 |
| 2023 | $1,253 | $39,400 | $5,720 | $33,680 |
| 2022 | $788 | $36,280 | $5,720 | $30,560 |
| 2021 | $697 | $32,160 | $5,720 | $26,440 |
| 2020 | $621 | $28,720 | $5,720 | $23,000 |
| 2019 | $667 | $28,720 | $5,720 | $23,000 |
| 2018 | $323 | $30,400 | $5,720 | $24,680 |
| 2017 | $660 | $30,400 | $5,720 | $24,680 |
| 2016 | $670 | $30,760 | $5,720 | $25,040 |
| 2015 | -- | $30,760 | $5,720 | $25,040 |
| 2014 | -- | $30,760 | $5,720 | $25,040 |
| 2013 | -- | $30,760 | $5,720 | $25,040 |
Source: Public Records
Map
Nearby Homes
- 1611 S Houston Rd
- 203 Pineview Dr
- 100 Brookwood Dr
- 107 Stanley Terrace
- 216 Randall Dr
- 141 Peacock Dr
- 86 Westcliff Cir
- 110 Westcliff Center St
- 102 Westcliff Center St Unit D
- 110 Merlin St
- 103 Westcliff Cir Unit A
- 103 Westcliff Cir Unit A
- 106 Westcliff Cir
- 105 Westcliff Cir
- 105 Westcliff Cir Unit A
- 504 Oakview Square
- 105 Robinhood Dr
- 110 Westcliff Cir Unit C
- 112 Peacock Dr
- 213 Ashby Way
- 93 Sheridan Way
- 202 S Houston Rd
- 95 Sheridan Way
- 203 S Houston Rd
- 422 Pine Valley Dr
- 205 S Houston Rd
- 103 Sheridan Way
- 424 Pine Valley Dr
- 96 Sheridan Way
- 101 Sheridan Way
- 207 S Houston Rd
- 98 Sheridan Way
- 103 Pineview Dr
- 420 Pine Valley Dr
- 209 S Houston Rd
- 211 S Houston Rd
- 100 Pierce Place
- 105 Pineview Dr
- 0 Sheridan Way
- 419 Pine Valley Dr