Estimated Value: $221,000 - $321,000
2
Beds
1
Bath
1,683
Sq Ft
$158/Sq Ft
Est. Value
About This Home
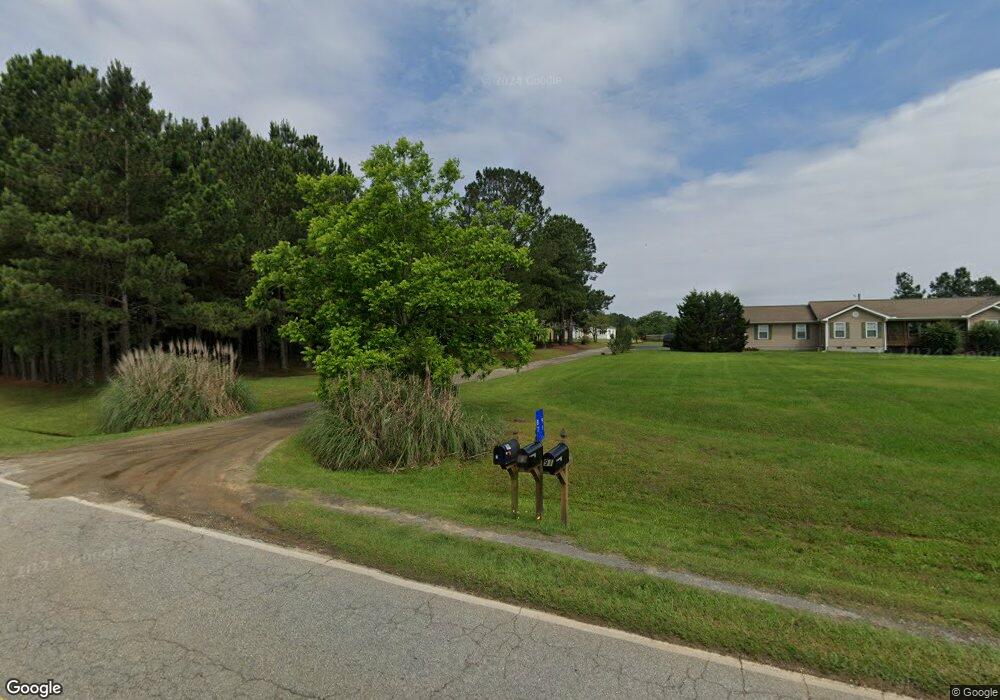
This home is located at 91 Shi Rd, Macon, GA 31220 and is currently estimated at $266,028, approximately $158 per square foot. 91 Shi Rd is a home located in Monroe County with nearby schools including T.G. Scott Elementary School, Mary Persons High School, and Monroe Academy.
Ownership History
Date
Name
Owned For
Owner Type
Purchase Details
Closed on
Aug 20, 2021
Sold by
Mason Jennifer J
Bought by
Ely Cindy Vonn
Current Estimated Value
Purchase Details
Closed on
Jan 21, 2019
Sold by
Mason Jennifer J
Bought by
Mason Jennifer J and Mason Christopher S
Purchase Details
Closed on
Dec 3, 2018
Sold by
Watson Richard Micheal
Bought by
Mason Jennifer J
Purchase Details
Closed on
Dec 14, 2006
Sold by
Not Provided
Bought by
Watson Richard M Mike
Create a Home Valuation Report for This Property
The Home Valuation Report is an in-depth analysis detailing your home's value as well as a comparison with similar homes in the area
Purchase History
| Date | Buyer | Sale Price | Title Company |
|---|---|---|---|
| Ely Cindy Vonn | $167,000 | -- | |
| Mason Jennifer J | -- | -- | |
| Mason Jennifer J | -- | -- | |
| Watson Richard M Mike | -- | -- |
Source: Public Records
Tax History
| Year | Tax Paid | Tax Assessment Tax Assessment Total Assessment is a certain percentage of the fair market value that is determined by local assessors to be the total taxable value of land and additions on the property. | Land | Improvement |
|---|---|---|---|---|
| 2025 | $1,181 | $53,960 | $10,600 | $43,360 |
| 2024 | $1,181 | $67,080 | $10,600 | $56,480 |
| 2023 | $1,488 | $61,120 | $10,600 | $50,520 |
| 2022 | $1,330 | $61,120 | $10,600 | $50,520 |
| 2021 | $1,210 | $43,164 | $10,600 | $32,564 |
| 2020 | $1,240 | $43,164 | $10,600 | $32,564 |
| 2019 | $898 | $31,004 | $10,600 | $20,404 |
| 2018 | $552 | $31,004 | $10,600 | $20,404 |
| 2017 | $901 | $31,004 | $10,600 | $20,404 |
| 2016 | $525 | $31,004 | $10,600 | $20,404 |
| 2015 | $498 | $31,004 | $10,600 | $20,404 |
| 2014 | $481 | $31,004 | $10,600 | $20,404 |
Source: Public Records
Map
Nearby Homes
- 37 Fawn Dr
- 112 Irongate
- 00 Irongate Unit Lot 17
- 158 Caroline Ct
- 140 Caroline Ct
- 121 James Place
- 202 Hilltop Cir
- 0 Zebulon Rd Unit 26279583
- 129 Burchwood Dr
- 66 Quail Trail
- 1359 Jenkins Rd
- 156 Cambridge Way
- 477 Old Rumble Rd Unit 4
- 477 Old Rumble Rd
- 443 Old Rumble Rd
- 443 Old Rumble Rd Unit 2
- 194 Cambridge Way
- Lot 15-A-2 Creekside Ln
- 598 Pea Ridge Rd
- Lot 15-A-1 Creekside Ln
Your Personal Tour Guide
Ask me questions while you tour the home.