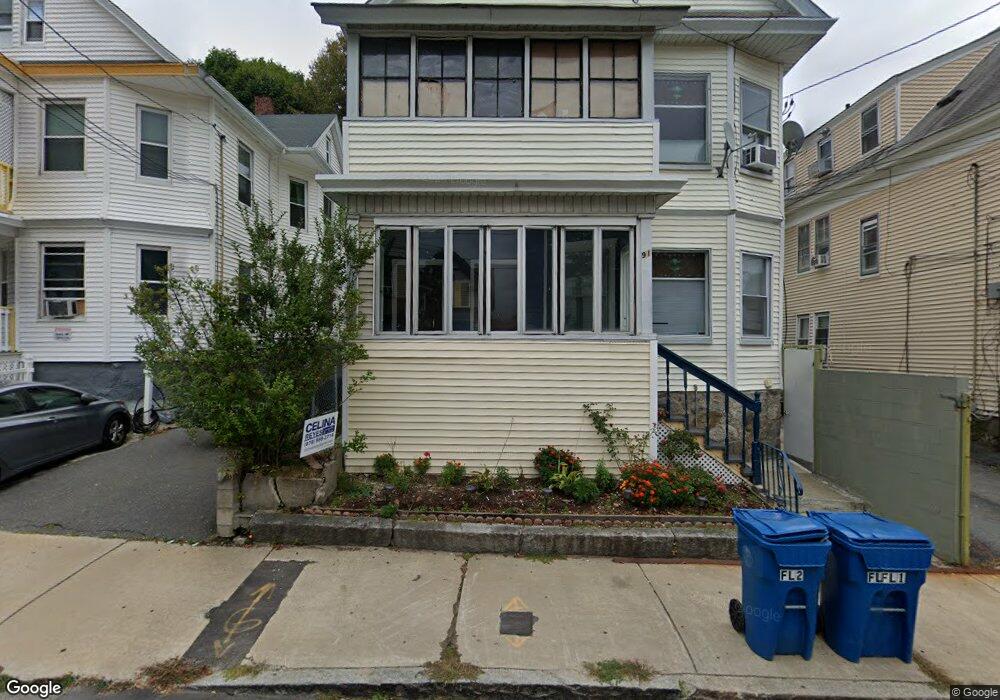
91 Trenton St Unit 93 Lawrence, MA 01841
Arlington NeighborhoodEstimated Value: $611,961 - $842,000
5
Beds
2
Baths
2,950
Sq Ft
$246/Sq Ft
Est. Value
About This Home
This home is located at 91 Trenton St Unit 93, Lawrence, MA 01841 and is currently estimated at $726,740, approximately $246 per square foot. 91 Trenton St Unit 93 is a home located in Essex County with nearby schools including School For Exceptional Studies and Central Catholic High School.
Ownership History
Date
Name
Owned For
Owner Type
Purchase Details
Closed on
Apr 30, 2018
Sold by
Lembert German P and Delia-Lembert Ana
Bought by
Grullon Jose N and Mendoza-Cruz Johanny D
Current Estimated Value
Home Financials for this Owner
Home Financials are based on the most recent Mortgage that was taken out on this home.
Original Mortgage
$412,392
Outstanding Balance
$354,837
Interest Rate
4.37%
Mortgage Type
FHA
Estimated Equity
$371,903
Purchase Details
Closed on
Dec 11, 2006
Sold by
Lembert German and Lembert Ana Delia
Bought by
Lembert Ana Delia
Home Financials for this Owner
Home Financials are based on the most recent Mortgage that was taken out on this home.
Original Mortgage
$210,000
Interest Rate
6.4%
Mortgage Type
Purchase Money Mortgage
Purchase Details
Closed on
Mar 1, 1996
Sold by
Fnma
Bought by
Lembert German P
Home Financials for this Owner
Home Financials are based on the most recent Mortgage that was taken out on this home.
Original Mortgage
$39,615
Interest Rate
7.02%
Mortgage Type
Purchase Money Mortgage
Purchase Details
Closed on
Nov 17, 1988
Sold by
Fitzpatrick Joe P
Bought by
Luna Rafael F
Home Financials for this Owner
Home Financials are based on the most recent Mortgage that was taken out on this home.
Original Mortgage
$103,900
Interest Rate
10.28%
Mortgage Type
Purchase Money Mortgage
Create a Home Valuation Report for This Property
The Home Valuation Report is an in-depth analysis detailing your home's value as well as a comparison with similar homes in the area
Home Values in the Area
Average Home Value in this Area
Purchase History
| Date | Buyer | Sale Price | Title Company |
|---|---|---|---|
| Grullon Jose N | $420,000 | -- | |
| Lembert Ana Delia | -- | -- | |
| Lembert German P | $41,700 | -- | |
| Luna Rafael F | $129,900 | -- |
Source: Public Records
Mortgage History
| Date | Status | Borrower | Loan Amount |
|---|---|---|---|
| Open | Grullon Jose N | $412,392 | |
| Previous Owner | Lembert Ana Delia | $210,000 | |
| Previous Owner | Luna Rafael F | $10,000 | |
| Previous Owner | Luna Rafael F | $39,615 | |
| Previous Owner | Luna Rafael F | $12,000 | |
| Previous Owner | Luna Rafael F | $103,900 |
Source: Public Records
Tax History Compared to Growth
Tax History
| Year | Tax Paid | Tax Assessment Tax Assessment Total Assessment is a certain percentage of the fair market value that is determined by local assessors to be the total taxable value of land and additions on the property. | Land | Improvement |
|---|---|---|---|---|
| 2025 | $5,520 | $627,300 | $96,400 | $530,900 |
| 2024 | $5,259 | $568,500 | $101,300 | $467,200 |
| 2023 | $5,445 | $535,900 | $97,800 | $438,100 |
| 2022 | $5,194 | $454,000 | $92,200 | $361,800 |
| 2021 | $5,047 | $411,300 | $92,200 | $319,100 |
| 2020 | $4,444 | $357,500 | $76,900 | $280,600 |
| 2019 | $4,208 | $307,600 | $57,100 | $250,500 |
| 2018 | $4,045 | $282,500 | $51,700 | $230,800 |
| 2017 | $3,631 | $236,700 | $49,100 | $187,600 |
| 2016 | $3,431 | $221,200 | $38,300 | $182,900 |
| 2015 | $3,290 | $217,600 | $38,300 | $179,300 |
Source: Public Records
Map
Nearby Homes
- 129-131 Lexington St
- 169 Berkeley St
- 24 Bennington St
- 183 Berkeley St
- 5 Arlington Terrace
- 20 Knox St Unit 43
- 20 Knox St Unit 23
- 131A Lawrence St Unit 40
- 32 Alma St Unit 32
- 6 Longwood Dr
- 434-438 Hampshire St
- 364 Lawrence St
- 27 Exchange St
- 2 Lawrence St
- 83 Oakside Ave
- 29 Willow St Unit B
- 82 Oakside Ave
- 87 Oakside Ave
- 192 Union St
- 65 Brook St
- 91-93 Trenton St
- 103-105 Trenton St
- 103 Trenton St Unit 105
- 87 Trenton St Unit 89
- 62-64 Eutaw St
- 111 Trenton St
- 85 Trenton St
- 66 Eutaw St Unit 68
- 70 Eutaw St Unit 72
- 60 Eutaw St
- 60 Eutaw St
- 96 Trenton St
- 113 Trenton St
- 33 Buswell St Unit 35
- 62 Eutaw St Unit 64
- 100 Trenton St Unit 102
- 76 Eutaw St
- 117 Trenton St Unit 119
- 37 Buswell St
- 108 Trenton St Unit 110