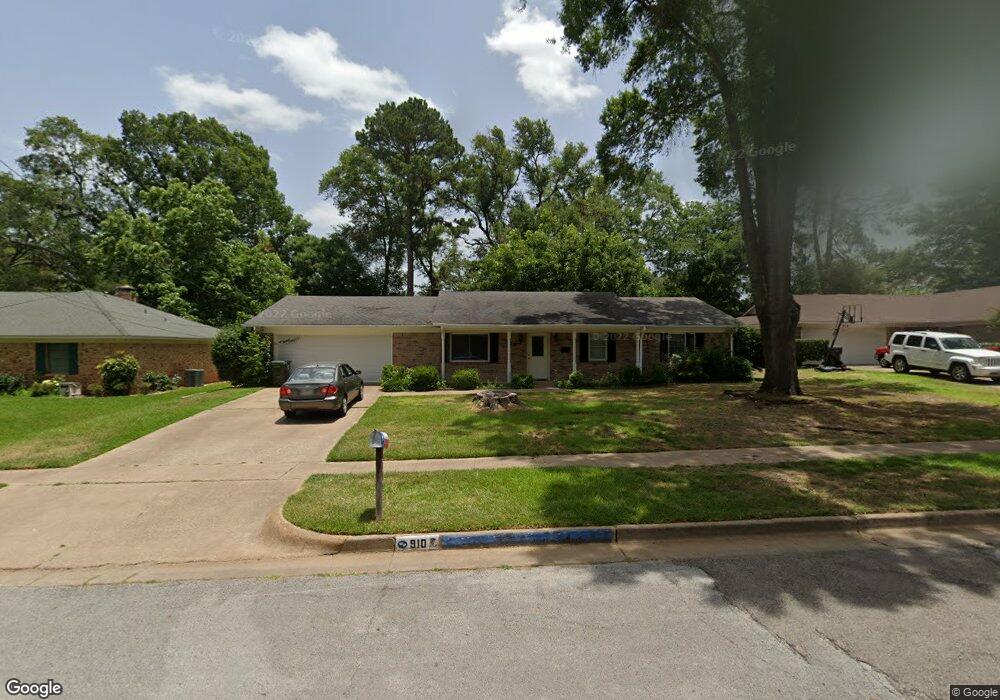
910 Bama Ln Tyler, TX 75701
Midtown Tyler NeighborhoodEstimated Value: $207,459 - $225,000
--
Bed
2
Baths
1,588
Sq Ft
$137/Sq Ft
Est. Value
About This Home
This home is located at 910 Bama Ln, Tyler, TX 75701 and is currently estimated at $217,865, approximately $137 per square foot. 910 Bama Ln is a home located in Smith County with nearby schools including Bell Elementary School, Moore Middle School, and Tyler High School.
Ownership History
Date
Name
Owned For
Owner Type
Purchase Details
Closed on
Apr 4, 2018
Sold by
Barrientos Isarel and Barrientos Cesilia
Bought by
Tamula Ryan Edward and Tamula Veronica
Current Estimated Value
Home Financials for this Owner
Home Financials are based on the most recent Mortgage that was taken out on this home.
Original Mortgage
$108,000
Outstanding Balance
$92,390
Interest Rate
4.4%
Mortgage Type
New Conventional
Estimated Equity
$125,475
Purchase Details
Closed on
Dec 18, 2014
Sold by
Winn Tile Co
Bought by
Barrientos Isreal and Barrientos Cesilia
Home Financials for this Owner
Home Financials are based on the most recent Mortgage that was taken out on this home.
Original Mortgage
$95,000
Interest Rate
3.93%
Mortgage Type
Purchase Money Mortgage
Purchase Details
Closed on
Jun 16, 2011
Sold by
Mcquigg Timothy and Hallmark Regena
Bought by
Winn Tile Company
Create a Home Valuation Report for This Property
The Home Valuation Report is an in-depth analysis detailing your home's value as well as a comparison with similar homes in the area
Home Values in the Area
Average Home Value in this Area
Purchase History
| Date | Buyer | Sale Price | Title Company |
|---|---|---|---|
| Tamula Ryan Edward | -- | None Available | |
| Barrientos Isreal | -- | None Available | |
| Winn Tile Company | -- | None Available |
Source: Public Records
Mortgage History
| Date | Status | Borrower | Loan Amount |
|---|---|---|---|
| Open | Tamula Ryan Edward | $108,000 | |
| Previous Owner | Barrientos Isreal | $95,000 |
Source: Public Records
Tax History Compared to Growth
Tax History
| Year | Tax Paid | Tax Assessment Tax Assessment Total Assessment is a certain percentage of the fair market value that is determined by local assessors to be the total taxable value of land and additions on the property. | Land | Improvement |
|---|---|---|---|---|
| 2024 | $2,846 | $167,278 | $19,950 | $147,328 |
| 2023 | $3,108 | $178,297 | $19,950 | $158,347 |
| 2022 | $3,272 | $166,987 | $19,950 | $147,037 |
| 2021 | $2,539 | $121,000 | $16,530 | $104,470 |
| 2020 | $2,589 | $121,000 | $16,530 | $104,470 |
| 2019 | $2,501 | $114,377 | $11,400 | $102,977 |
| 2018 | $2,366 | $108,770 | $11,400 | $97,370 |
| 2017 | $2,322 | $108,770 | $11,400 | $97,370 |
| 2016 | $2,228 | $104,355 | $11,400 | $92,955 |
| 2015 | $2,140 | $103,840 | $11,400 | $92,440 |
| 2014 | $2,140 | $100,710 | $11,400 | $89,310 |
Source: Public Records
Map
Nearby Homes
- 1432 E Don St
- 1528 E Devine St
- 837 S Palmer Ave
- 912 S Palmer Ave
- 1314 E Dawson St
- 1910 E Lake St
- 613 S Baxter Ave
- 1914 Parklen St
- 1226 S Fleishel Ave
- 1704 E Houston St
- 1919 E Ferdell St
- 1513 E Lawrence St
- 834 S Tipton Ave
- 1220 E Front St
- 1725 S Mahon Ave
- 1730 S Mahon Ave
- 1515 E 6th St
- 2015 E 5th St
- 2313 Danica Dr
- 1715 Ridgeview Dr