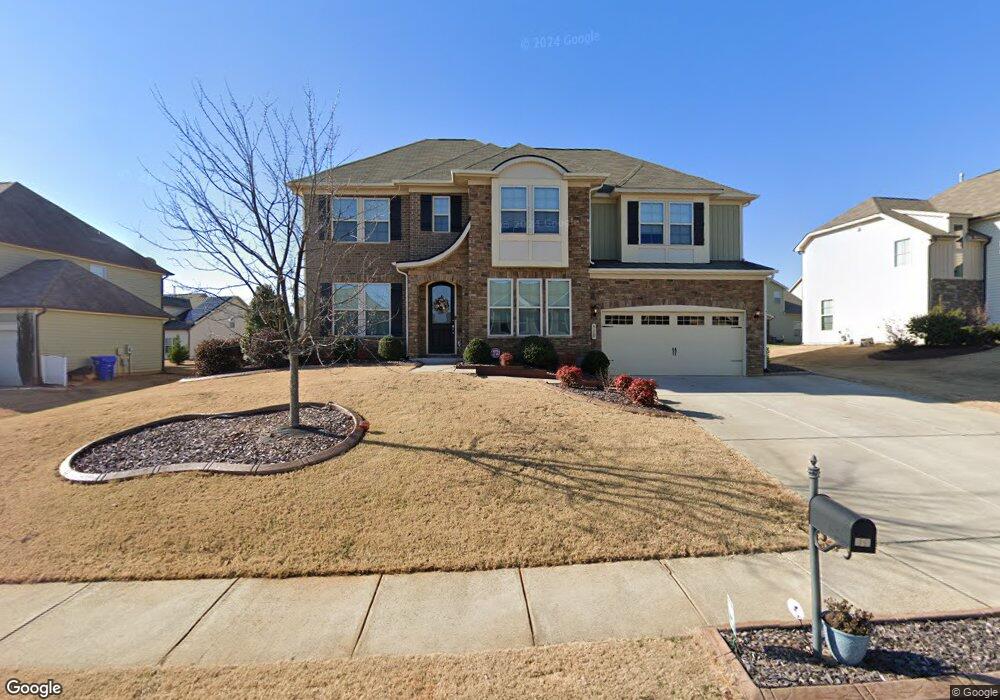
910 Beech Glen Dr Mebane, NC 27302
Estimated Value: $534,000 - $558,000
5
Beds
4
Baths
3,471
Sq Ft
$157/Sq Ft
Est. Value
About This Home
This home is located at 910 Beech Glen Dr, Mebane, NC 27302 and is currently estimated at $545,416, approximately $157 per square foot. 910 Beech Glen Dr is a home located in Alamance County with nearby schools including South Mebane Elementary School, Woodlawn Middle School, and Bradford Academy.
Ownership History
Date
Name
Owned For
Owner Type
Purchase Details
Closed on
Dec 11, 2025
Sold by
Oyefesobi Adiah and Oyefesobi Olumuyiwa
Bought by
Oyefesobi Adiah
Current Estimated Value
Purchase Details
Closed on
Sep 18, 2025
Sold by
Oyefesobi Adiah and Oyefesobi Olumuyiwa
Bought by
Oyefesobi Adiah
Purchase Details
Closed on
Dec 18, 2019
Sold by
Woods Cuabeya L
Bought by
Oyefesobi Adiah and Oyefesobi Olumuyiwa
Home Financials for this Owner
Home Financials are based on the most recent Mortgage that was taken out on this home.
Original Mortgage
$335,000
Interest Rate
3.6%
Mortgage Type
New Conventional
Purchase Details
Closed on
Mar 26, 2019
Sold by
Woods Latasha S
Bought by
Woods Cuabeya L
Purchase Details
Closed on
May 22, 2015
Sold by
Dan Ryan Builders N C Llc
Bought by
Woods Cuabeya L
Home Financials for this Owner
Home Financials are based on the most recent Mortgage that was taken out on this home.
Original Mortgage
$292,850
Interest Rate
3.79%
Mortgage Type
New Conventional
Create a Home Valuation Report for This Property
The Home Valuation Report is an in-depth analysis detailing your home's value as well as a comparison with similar homes in the area
Home Values in the Area
Average Home Value in this Area
Purchase History
| Date | Buyer | Sale Price | Title Company |
|---|---|---|---|
| Oyefesobi Adiah | -- | None Listed On Document | |
| Oyefesobi Adiah | -- | None Listed On Document | |
| Oyefesobi Adiah | $360,000 | Attorney | |
| Woods Cuabeya L | -- | None Available | |
| Woods Cuabeya L | $309,000 | -- |
Source: Public Records
Mortgage History
| Date | Status | Borrower | Loan Amount |
|---|---|---|---|
| Previous Owner | Oyefesobi Adiah | $335,000 | |
| Previous Owner | Woods Cuabeya L | $292,850 |
Source: Public Records
Tax History
| Year | Tax Paid | Tax Assessment Tax Assessment Total Assessment is a certain percentage of the fair market value that is determined by local assessors to be the total taxable value of land and additions on the property. | Land | Improvement |
|---|---|---|---|---|
| 2025 | $5,213 | $603,354 | $55,000 | $548,354 |
| 2024 | $5,062 | $603,354 | $55,000 | $548,354 |
| 2023 | $4,815 | $603,354 | $55,000 | $548,354 |
| 2022 | $3,583 | $321,521 | $40,000 | $281,521 |
| 2021 | $3,615 | $321,521 | $40,000 | $281,521 |
| 2020 | $3,647 | $321,521 | $40,000 | $281,521 |
| 2019 | $3,665 | $321,521 | $40,000 | $281,521 |
| 2018 | $0 | $321,521 | $40,000 | $281,521 |
| 2017 | $3,376 | $321,521 | $40,000 | $281,521 |
| 2016 | $3,220 | $300,938 | $40,000 | $260,938 |
| 2015 | $196 | $34,000 | $34,000 | $0 |
| 2014 | -- | $34,000 | $34,000 | $0 |
Source: Public Records
Map
Nearby Homes
- 603 Applecross Dr
- 603 Bunker Dr
- 212 Parker Ln
- 502 Fairway Dr
- 198 Parker Ln
- 210 Parker Ln
- 206 Parker Ln
- 192 Parker Ln
- 128 Parker Ln
- Plan 1550 Modeled at Peartree Towns
- Plan 1459 Modeled at Peartree Towns
- 112 Parker Ln
- 110 Parker Ln
- 862 Pryor St
- 1018 Abbott St
- 705 S Fifth St
- 191 Parker Ln
- 193 Parker Ln
- 933 Arrowhead Ct
- 107 Norwood Ct N
- 908 Beech Glen Dr
- 710 Fairway Dr
- 914 Beech Glen Dr
- 706 Fairway Dr
- 708 Fairway Dr
- 915 Beech Glen Dr
- 913 Beech Glen Dr
- 906 Beech Glen Dr
- 712 Fairway Dr
- 917 Beech Glen Dr
- 704 Fairway Dr
- 911 Beech Glen Dr
- 916 Beech Glen Dr
- 919 Beech Glen Dr
- 904 Beech Glen Dr
- 909 Beech Glen Dr
- 702 Fairway Dr
- 912 Avalon Dr
- 709 Fairway Dr
- 910 Avalon Dr
Your Personal Tour Guide
Ask me questions while you tour the home.