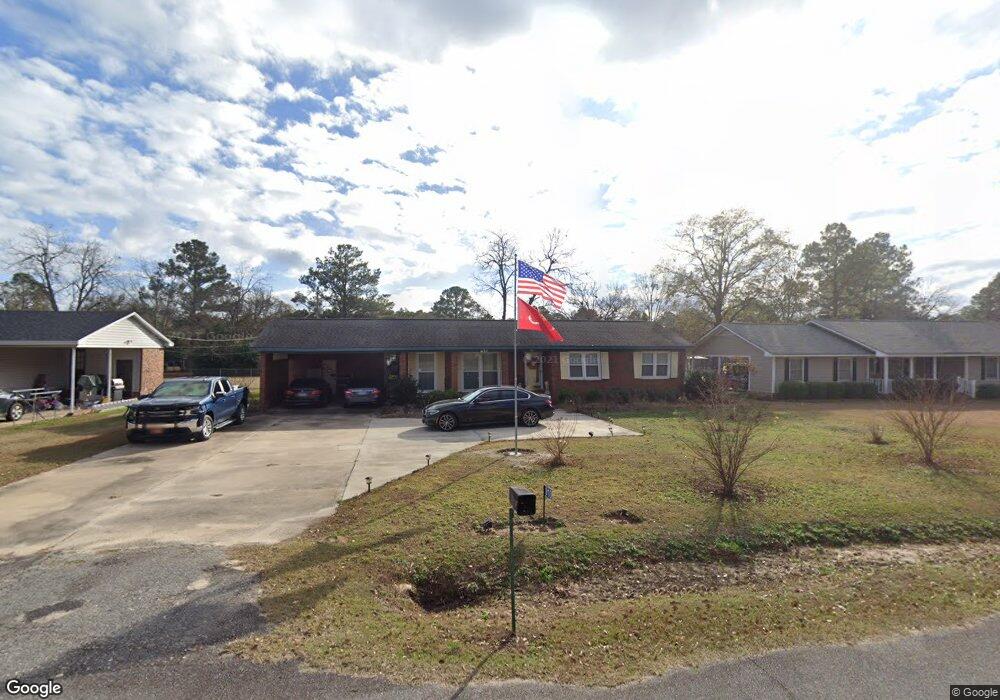
910 E 28th Ave Cordele, GA 31015
Estimated Value: $161,532 - $183,000
3
Beds
2
Baths
1,350
Sq Ft
$128/Sq Ft
Est. Value
About This Home
This home is located at 910 E 28th Ave, Cordele, GA 31015 and is currently estimated at $172,383, approximately $127 per square foot. 910 E 28th Ave is a home located in Crisp County with nearby schools including Crisp County Elementary School, Crisp County Primary School, and Crisp County Middle School.
Ownership History
Date
Name
Owned For
Owner Type
Purchase Details
Closed on
Jun 14, 2006
Sold by
Community National Bank
Bought by
Shiloh Willie L
Current Estimated Value
Home Financials for this Owner
Home Financials are based on the most recent Mortgage that was taken out on this home.
Original Mortgage
$60,000
Outstanding Balance
$34,896
Interest Rate
6.57%
Mortgage Type
New Conventional
Estimated Equity
$137,487
Purchase Details
Closed on
Apr 7, 2005
Sold by
Holmes George M and Holmes Judy G
Bought by
Community National Bank
Purchase Details
Closed on
Mar 15, 2001
Sold by
Holmes Madeline J
Bought by
Holmes George M and Holmes Judy G
Purchase Details
Closed on
Jan 4, 1999
Sold by
Holmes Geo and Holmes Madeline
Bought by
Holmes Madeline J
Purchase Details
Closed on
May 31, 1973
Sold by
Lynwood Strictland I
Bought by
Holmes Geo and Holmes Madeline
Purchase Details
Closed on
Dec 4, 1972
Bought by
Lynwood Strictland I
Create a Home Valuation Report for This Property
The Home Valuation Report is an in-depth analysis detailing your home's value as well as a comparison with similar homes in the area
Purchase History
| Date | Buyer | Sale Price | Title Company |
|---|---|---|---|
| Shiloh Willie L | $75,000 | -- | |
| Community National Bank | $85,000 | -- | |
| Holmes George M | $48,300 | -- | |
| Holmes Madeline J | -- | -- | |
| Holmes Geo | $26,000 | -- | |
| Lynwood Strictland I | -- | -- |
Source: Public Records
Mortgage History
| Date | Status | Borrower | Loan Amount |
|---|---|---|---|
| Open | Shiloh Willie L | $60,000 |
Source: Public Records
Tax History
| Year | Tax Paid | Tax Assessment Tax Assessment Total Assessment is a certain percentage of the fair market value that is determined by local assessors to be the total taxable value of land and additions on the property. | Land | Improvement |
|---|---|---|---|---|
| 2025 | $1,438 | $53,534 | $2,700 | $50,834 |
| 2024 | $1,339 | $48,908 | $2,700 | $46,208 |
| 2023 | $1,753 | $46,742 | $2,700 | $44,042 |
| 2022 | $1,174 | $44,429 | $2,700 | $41,729 |
| 2021 | $1,151 | $42,115 | $2,700 | $39,415 |
| 2020 | $1,185 | $42,115 | $2,700 | $39,415 |
| 2019 | $1,194 | $42,115 | $2,700 | $39,415 |
| 2018 | $803 | $27,239 | $3,240 | $23,999 |
| 2017 | $1,106 | $27,239 | $3,240 | $23,999 |
| 2016 | $805 | $27,239 | $3,240 | $23,999 |
| 2015 | -- | $27,239 | $3,240 | $23,999 |
| 2014 | -- | $27,239 | $3,240 | $23,999 |
| 2013 | -- | $27,238 | $3,240 | $23,998 |
Source: Public Records
Map
Nearby Homes
- 1018 E 28th Ave
- 615 E 28th Ave
- 618 E 27th Ave
- 614 E 26th Ave
- E 8th Ave
- 120 Edgewood Dr
- 1206 Fleming Rd
- 412 E 30th Ave
- 912 Rose Ln
- 1002 Camellia Dr
- 1410 E 24th Ave
- 720 E 20th Ave
- 1304 Robin St
- 1506 E 24th Ave
- 1603 Pine Acres Dr
- 1001 Stewart Ave
- 716 E 18th Ave
- 714 E 18th Ave
- 709 Fleming Rd
- 1509 E 20th Ave
- 914 E 28th Ave
- 906 E 28th Ave
- 907 E 29th Ave
- 916 E 28th Ave
- 911 E 29th Ave
- 905 E 29th Ave
- 909 E 28th Ave
- 903 E 28th Ave
- 915 E 29th Ave
- 813 E 29th Ave
- 901 E 29th Ave
- 915 E 28th Ave
- 815 E 28th Ave
- 810 E 28th Ave
- 809 E 29th Ave
- 1002 E 28th Ave
- 908 E 29th Ave
- 806 E 28th Ave
- 912 E 29th Ave
- 1001 E 29th Ave
Your Personal Tour Guide
Ask me questions while you tour the home.