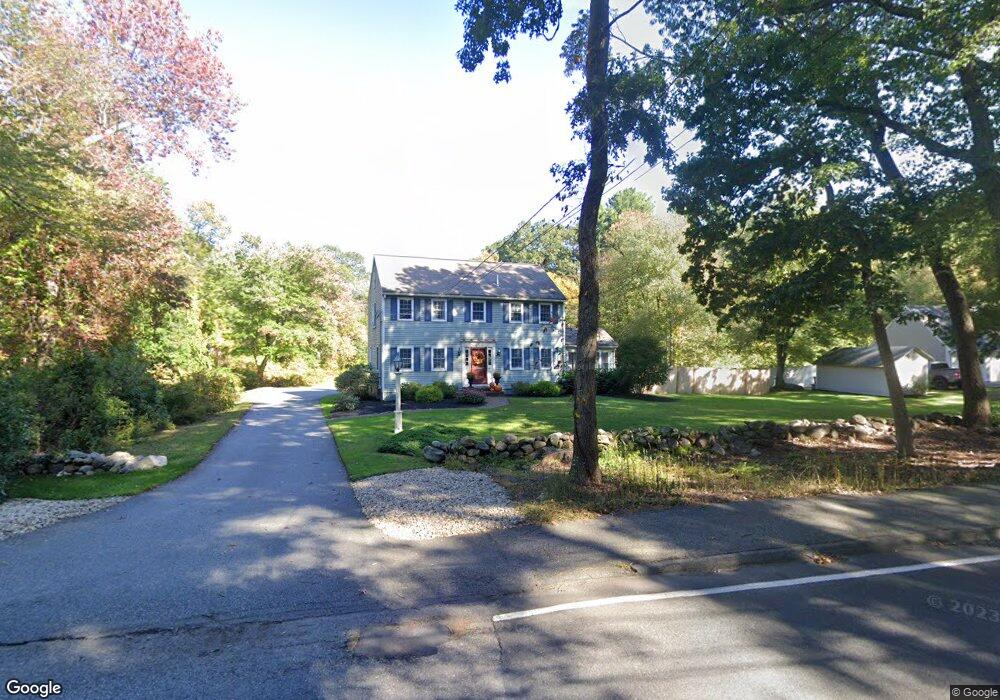
910 Johnson St North Andover, MA 01845
Estimated Value: $929,810 - $1,006,000
4
Beds
3
Baths
2,814
Sq Ft
$345/Sq Ft
Est. Value
About This Home
This home is located at 910 Johnson St, North Andover, MA 01845 and is currently estimated at $969,453, approximately $344 per square foot. 910 Johnson St is a home located in Essex County with nearby schools including Annie L Sargent Elementary School, North Andover Middle School, and North Andover High School.
Ownership History
Date
Name
Owned For
Owner Type
Purchase Details
Closed on
May 31, 2006
Sold by
Samenuk David and Samenuk Karen L
Bought by
Moran Dennis and Moran Maureen
Current Estimated Value
Home Financials for this Owner
Home Financials are based on the most recent Mortgage that was taken out on this home.
Original Mortgage
$225,000
Interest Rate
6.55%
Mortgage Type
Purchase Money Mortgage
Purchase Details
Closed on
Jun 30, 2000
Sold by
Headrick Ronald and Covino-Headrick Diana
Bought by
Samenuk David and Samenuk Karen L
Purchase Details
Closed on
Aug 16, 1993
Sold by
Vanhouten John D
Bought by
Headrick Ronald
Create a Home Valuation Report for This Property
The Home Valuation Report is an in-depth analysis detailing your home's value as well as a comparison with similar homes in the area
Home Values in the Area
Average Home Value in this Area
Purchase History
| Date | Buyer | Sale Price | Title Company |
|---|---|---|---|
| Moran Dennis | $587,000 | -- | |
| Samenuk David | $398,000 | -- | |
| Headrick Ronald | $255,000 | -- |
Source: Public Records
Mortgage History
| Date | Status | Borrower | Loan Amount |
|---|---|---|---|
| Open | Headrick Ronald | $224,000 | |
| Closed | Moran Dennis | $225,000 | |
| Previous Owner | Headrick Ronald | $351,000 |
Source: Public Records
Tax History
| Year | Tax Paid | Tax Assessment Tax Assessment Total Assessment is a certain percentage of the fair market value that is determined by local assessors to be the total taxable value of land and additions on the property. | Land | Improvement |
|---|---|---|---|---|
| 2025 | $9,385 | $833,500 | $413,900 | $419,600 |
| 2024 | $8,912 | $803,600 | $392,100 | $411,500 |
| 2023 | $8,487 | $693,400 | $331,200 | $362,200 |
| 2022 | $8,099 | $598,600 | $287,600 | $311,000 |
| 2021 | $7,785 | $549,400 | $261,500 | $287,900 |
| 2020 | $7,458 | $542,800 | $254,900 | $287,900 |
| 2019 | $7,279 | $542,800 | $254,900 | $287,900 |
| 2018 | $7,887 | $542,800 | $254,900 | $287,900 |
| 2017 | $6,916 | $484,300 | $224,400 | $259,900 |
| 2016 | $6,628 | $464,500 | $226,600 | $237,900 |
| 2015 | $6,532 | $453,900 | $213,100 | $240,800 |
Source: Public Records
Map
Nearby Homes
- 45 Thistle Rd
- 71 Regency Place
- 37 Sullivan St
- 15 Alcott Way
- 7 Sullivan St
- 104 Salem St
- 124 Quail Run Rd
- 136 Quail Run Rd
- 133B Salem
- 52 Salem St
- 53 Salem St
- 88 Johnson St
- 447 Stevens St
- 3 Great Pond Rd
- 35 Peters St
- Lot 10 Stonecleave Rd
- 33 Chestnut St Unit 2
- 100.5 Main St Unit Q
- 2 Kingston St Unit 2
- 96 N Main St Unit 3
Your Personal Tour Guide
Ask me questions while you tour the home.