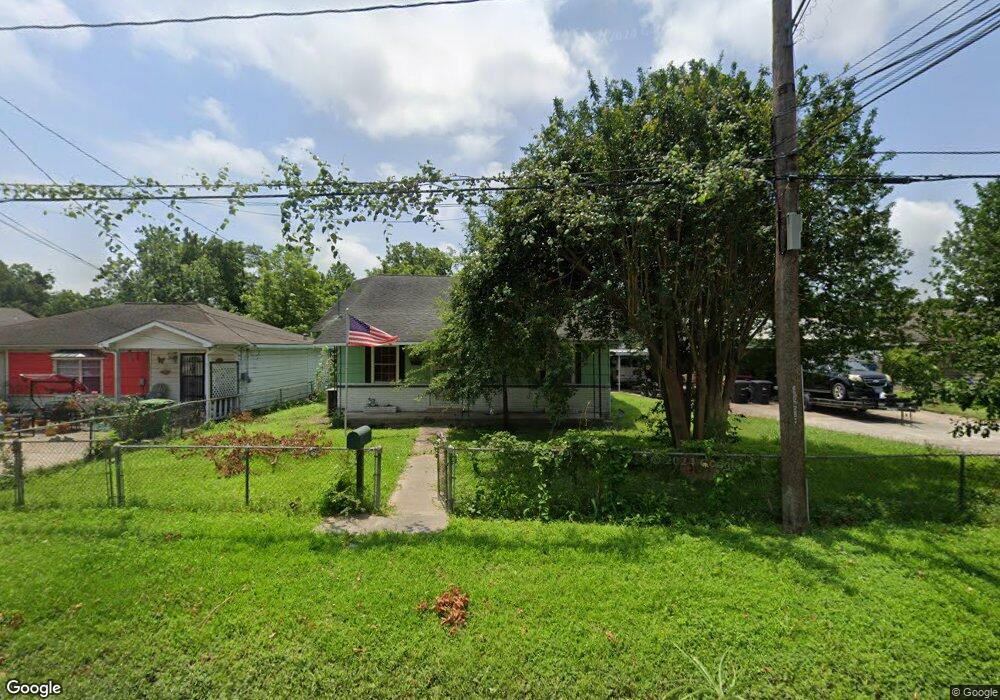
910 Knight St Houston, TX 77022
Northside-Northline NeighborhoodEstimated Value: $287,000 - $347,179
4
Beds
2
Baths
1,856
Sq Ft
$175/Sq Ft
Est. Value
About This Home
This home is located at 910 Knight St, Houston, TX 77022 and is currently estimated at $325,295, approximately $175 per square foot. 910 Knight St is a home located in Harris County with nearby schools including Burbank Elementary School, Burbank Middle School, and Sam Houston Math, Science & Technology Center.
Ownership History
Date
Name
Owned For
Owner Type
Purchase Details
Closed on
Feb 5, 2024
Sold by
Longoria Athena C
Bought by
Cantu Guadalupe and Cantu Tina S
Current Estimated Value
Home Financials for this Owner
Home Financials are based on the most recent Mortgage that was taken out on this home.
Original Mortgage
$50,000
Outstanding Balance
$34,071
Interest Rate
6.61%
Mortgage Type
Seller Take Back
Estimated Equity
$291,224
Create a Home Valuation Report for This Property
The Home Valuation Report is an in-depth analysis detailing your home's value as well as a comparison with similar homes in the area
Home Values in the Area
Average Home Value in this Area
Purchase History
| Date | Buyer | Sale Price | Title Company |
|---|---|---|---|
| Cantu Guadalupe | -- | Great American Title |
Source: Public Records
Mortgage History
| Date | Status | Borrower | Loan Amount |
|---|---|---|---|
| Open | Cantu Guadalupe | $50,000 |
Source: Public Records
Tax History Compared to Growth
Tax History
| Year | Tax Paid | Tax Assessment Tax Assessment Total Assessment is a certain percentage of the fair market value that is determined by local assessors to be the total taxable value of land and additions on the property. | Land | Improvement |
|---|---|---|---|---|
| 2025 | $32 | $343,413 | $273,600 | $69,813 |
| 2024 | $32 | $319,670 | $251,100 | $68,570 |
| 2023 | $32 | $259,666 | $153,000 | $106,666 |
| 2022 | $4,491 | $235,745 | $153,000 | $82,745 |
| 2021 | $4,322 | $213,334 | $153,000 | $60,334 |
| 2020 | $4,082 | $205,513 | $153,000 | $52,513 |
| 2019 | $3,878 | $181,596 | $126,000 | $55,596 |
| 2018 | $0 | $148,750 | $105,300 | $43,450 |
| 2017 | $6,405 | $148,750 | $105,300 | $43,450 |
| 2016 | $2,911 | $139,027 | $99,000 | $40,027 |
| 2015 | -- | $104,677 | $62,000 | $42,677 |
| 2014 | -- | $104,677 | $62,000 | $42,677 |
Source: Public Records
Map
Nearby Homes
- 723 Doverside St
- 807 Firnat St
- 1207 Firnat St
- 9026 Mcgallion Rd
- 702 Pennington St
- 8411 Berry Brush Ln
- 88 Berry Rd
- 8402 Berry Green Ln
- 802 Berry Sage Ln
- 1104 Charnwood St
- 411 Berry Rd
- 8205 Appleton St
- 631 Apache St
- 318 Charlock St
- 743 Apache St
- 714 Apache St
- 253 De Boll St
- 249 De Boll St
- 0 Appleton St
- 216 Burress St