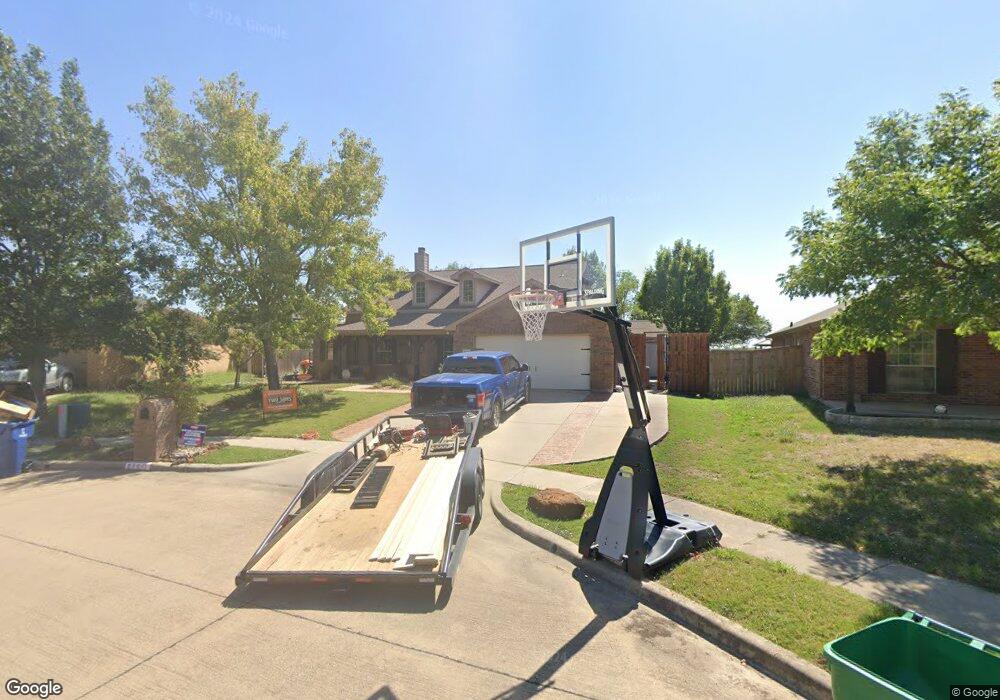
910 Mellanie Ct Celina, TX 75009
Estimated Value: $479,000 - $571,000
5
Beds
3
Baths
2,889
Sq Ft
$182/Sq Ft
Est. Value
About This Home
This home is located at 910 Mellanie Ct, Celina, TX 75009 and is currently estimated at $527,052, approximately $182 per square foot. 910 Mellanie Ct is a home located in Collin County with nearby schools including Celina Primary School, Marcy B. Lykins Elementary School, and Moore Middle School.
Ownership History
Date
Name
Owned For
Owner Type
Purchase Details
Closed on
Aug 7, 2018
Sold by
Dunning David and Dunning Mary E
Bought by
Oldham Christopher D and Oldham Katherine A
Current Estimated Value
Home Financials for this Owner
Home Financials are based on the most recent Mortgage that was taken out on this home.
Original Mortgage
$293,550
Outstanding Balance
$254,936
Interest Rate
4.5%
Mortgage Type
Purchase Money Mortgage
Estimated Equity
$272,116
Purchase Details
Closed on
Jun 17, 2003
Sold by
Choice Homes Inc
Bought by
Dunning David and Dunning Mary E
Home Financials for this Owner
Home Financials are based on the most recent Mortgage that was taken out on this home.
Original Mortgage
$135,000
Interest Rate
5.27%
Mortgage Type
Purchase Money Mortgage
Create a Home Valuation Report for This Property
The Home Valuation Report is an in-depth analysis detailing your home's value as well as a comparison with similar homes in the area
Home Values in the Area
Average Home Value in this Area
Purchase History
| Date | Buyer | Sale Price | Title Company |
|---|---|---|---|
| Oldham Christopher D | -- | Chicago Title | |
| Dunning David | -- | American Title |
Source: Public Records
Mortgage History
| Date | Status | Borrower | Loan Amount |
|---|---|---|---|
| Open | Oldham Christopher D | $293,550 | |
| Previous Owner | Dunning David | $135,000 | |
| Closed | Dunning David | $25,319 |
Source: Public Records
Tax History Compared to Growth
Tax History
| Year | Tax Paid | Tax Assessment Tax Assessment Total Assessment is a certain percentage of the fair market value that is determined by local assessors to be the total taxable value of land and additions on the property. | Land | Improvement |
|---|---|---|---|---|
| 2025 | $8,008 | $499,080 | $157,500 | $341,944 |
| 2024 | $8,008 | $453,709 | $157,500 | $361,283 |
| 2023 | $8,008 | $412,463 | $126,000 | $347,712 |
| 2022 | $8,594 | $374,966 | $94,500 | $337,362 |
| 2021 | $7,960 | $340,878 | $68,250 | $272,628 |
| 2020 | $7,814 | $322,195 | $68,250 | $253,945 |
| 2019 | $7,385 | $289,936 | $57,750 | $232,186 |
| 2018 | $6,045 | $236,424 | $57,750 | $209,832 |
| 2017 | $5,496 | $250,805 | $47,250 | $203,555 |
| 2016 | $5,031 | $222,262 | $47,250 | $175,012 |
| 2015 | $3,937 | $189,516 | $36,750 | $152,766 |
Source: Public Records
Map
Nearby Homes
- 930 Mellanie Ct
- 890 Mellanie Ct
- 949 Sunset Blvd
- 950 Mellanie Ct
- 880 Mellanie Ct
- 951 W Sunset Blvd
- 535 S Alabama St
- 860 Mellanie Ct
- 870 Mellanie Ct
- 533 S Alabama St
- 811 W Sunset Blvd
- TBD W Sunset Blvd
- 531 S Alabama St
- 930 W Cedar St
- 950 W Cedar St
- 1011 W Sunset Blvd
- 910 W Cedar St
- 538 S Alabama St
- 970 W Cedar St