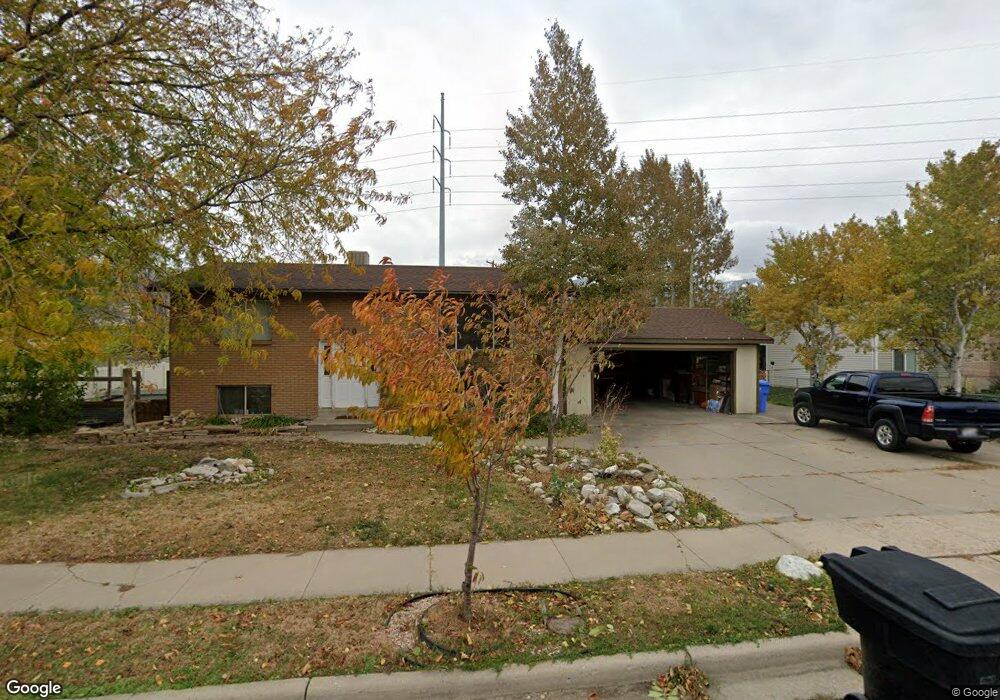
910 N 600 W West Bountiful, UT 84087
Estimated Value: $465,000 - $505,873
4
Beds
2
Baths
1,824
Sq Ft
$261/Sq Ft
Est. Value
About This Home
This home is located at 910 N 600 W, West Bountiful, UT 84087 and is currently estimated at $476,968, approximately $261 per square foot. 910 N 600 W is a home located in Davis County with nearby schools including West Bountiful Elementary School, Bountiful Junior High School, and Viewmont High School.
Ownership History
Date
Name
Owned For
Owner Type
Purchase Details
Closed on
Mar 21, 2014
Sold by
Randall Jacob
Bought by
Reber Nathan D and Reber Alessa M
Current Estimated Value
Home Financials for this Owner
Home Financials are based on the most recent Mortgage that was taken out on this home.
Original Mortgage
$190,486
Outstanding Balance
$144,710
Interest Rate
4.4%
Mortgage Type
FHA
Estimated Equity
$332,258
Purchase Details
Closed on
Oct 11, 2013
Sold by
The Bank Of New York Mellon
Bought by
Randall Jacob
Purchase Details
Closed on
May 30, 2013
Sold by
Shepherd Robert Scott and Shepherd Cynthia Olene
Bought by
Bank Of America Na
Purchase Details
Closed on
Oct 4, 2002
Sold by
Shepherd Robert Scott
Bought by
Shepherd Robert Scott and Shepherd Cynthia Olene
Create a Home Valuation Report for This Property
The Home Valuation Report is an in-depth analysis detailing your home's value as well as a comparison with similar homes in the area
Home Values in the Area
Average Home Value in this Area
Purchase History
| Date | Buyer | Sale Price | Title Company |
|---|---|---|---|
| Reber Nathan D | -- | Inwest Title Svcs | |
| Randall Jacob | -- | United Title Services | |
| Bank Of America Na | $135,000 | Trustees Title & Esc | |
| Shepherd Robert Scott | -- | Inwest Title Services Inc | |
| Shepherd Robert Scott | -- | Inwest Title Services Inc |
Source: Public Records
Mortgage History
| Date | Status | Borrower | Loan Amount |
|---|---|---|---|
| Open | Reber Nathan D | $190,486 |
Source: Public Records
Tax History Compared to Growth
Tax History
| Year | Tax Paid | Tax Assessment Tax Assessment Total Assessment is a certain percentage of the fair market value that is determined by local assessors to be the total taxable value of land and additions on the property. | Land | Improvement |
|---|---|---|---|---|
| 2025 | $2,860 | $231,000 | $124,598 | $106,402 |
| 2024 | $2,625 | $229,350 | $102,621 | $126,729 |
| 2023 | $2,525 | $406,000 | $192,986 | $213,014 |
| 2022 | $2,478 | $222,750 | $93,479 | $129,271 |
| 2021 | $2,519 | $316,000 | $127,813 | $188,187 |
| 2020 | $2,332 | $283,000 | $117,248 | $165,752 |
| 2019 | $2,157 | $268,000 | $117,244 | $150,756 |
| 2018 | $1,928 | $241,000 | $115,799 | $125,201 |
| 2016 | $1,585 | $114,730 | $37,528 | $77,202 |
| 2015 | $1,521 | $104,940 | $37,528 | $67,412 |
| 2014 | $1,098 | $77,128 | $37,528 | $39,600 |
| 2013 | -- | $88,968 | $32,069 | $56,899 |
Source: Public Records
Map
Nearby Homes
- 790 N 500 W
- 366 W 1000 N
- Lincoln Farmhouse Plan at Belmont Farms
- Belmont Traditional Plan at Belmont Farms
- Hampton Traditional Plan at Belmont Farms
- 340 N 500 W Unit 204
- 825 W 1320 N
- 637 W 1600 N
- 399 W 400 N Unit 47
- 553 N 200 W
- 184 Park Shadows Cir
- 235 W 1400 N
- 1194 N 200 W
- 1503 N 300 W
- 499 N 200 W Unit 30
- 499 N 200 W Unit 19
- 1260 N 200 W
- 810 Park Shadows Cir
- 1410 N 200 W
- 106 W 700 N