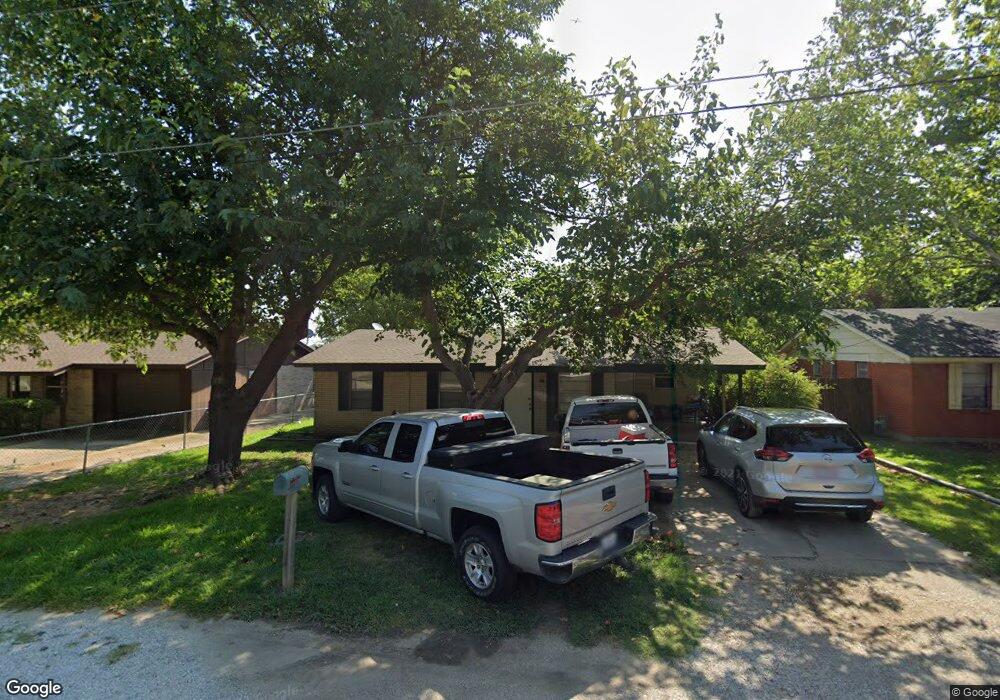
910 N 8th St Sanger, TX 76266
Estimated Value: $168,355 - $243,000
3
Beds
1
Bath
1,089
Sq Ft
$194/Sq Ft
Est. Value
About This Home
This home is located at 910 N 8th St, Sanger, TX 76266 and is currently estimated at $211,339, approximately $194 per square foot. 910 N 8th St is a home located in Denton County with nearby schools including Chisholm Trail Elementary School, Clear Creek Intermediate School, and Sanger Sixth Grade Campus.
Ownership History
Date
Name
Owned For
Owner Type
Purchase Details
Closed on
May 28, 2025
Sold by
Cancino Jesus
Bought by
Jesus And Irma Cancino Revocable Living Trust and Cancino
Current Estimated Value
Purchase Details
Closed on
Oct 29, 2012
Sold by
Fannie Mae
Bought by
Cancino Jesus
Purchase Details
Closed on
Sep 6, 2012
Sold by
Jpmorgan Chase Bank Na
Bought by
Federal National Mortgage Association
Purchase Details
Closed on
Sep 4, 2012
Sold by
Fitzpatrick James H
Bought by
Jpmorgan Chase Bank National Association
Create a Home Valuation Report for This Property
The Home Valuation Report is an in-depth analysis detailing your home's value as well as a comparison with similar homes in the area
Home Values in the Area
Average Home Value in this Area
Purchase History
| Date | Buyer | Sale Price | Title Company |
|---|---|---|---|
| Jesus And Irma Cancino Revocable Living Trust | -- | None Listed On Document | |
| Cancino Jesus | -- | None Available | |
| Federal National Mortgage Association | -- | None Available | |
| Jpmorgan Chase Bank National Association | $36,425 | None Available |
Source: Public Records
Tax History
| Year | Tax Paid | Tax Assessment Tax Assessment Total Assessment is a certain percentage of the fair market value that is determined by local assessors to be the total taxable value of land and additions on the property. | Land | Improvement |
|---|---|---|---|---|
| 2025 | $1,839 | $94,895 | $54,270 | $40,625 |
| 2024 | $1,839 | $91,000 | $41,180 | $49,820 |
| 2023 | $1,844 | $91,000 | $41,180 | $49,820 |
| 2022 | $2,039 | $91,927 | $33,165 | $58,762 |
| 2021 | $1,748 | $83,169 | $27,135 | $56,034 |
| 2020 | $1,528 | $69,037 | $27,135 | $41,902 |
| 2019 | $1,600 | $70,269 | $27,135 | $43,134 |
| 2018 | $1,367 | $59,732 | $27,135 | $32,597 |
| 2017 | $1,371 | $59,615 | $27,135 | $32,480 |
| 2016 | $1,045 | $45,430 | $15,075 | $30,355 |
| 2015 | -- | $40,659 | $15,075 | $25,584 |
| 2013 | -- | $56,878 | $15,075 | $41,803 |
Source: Public Records
Map
Nearby Homes
- 4551 Farm To Market Road 455
- 2164 Farm To Market Road 455
- 902 Plum St
- Tbd I-35
- 612 N 10th St
- 4063 Farm To Market 455 W
- 2300
- 1209 Bolivar St
- 1149 Serendipity Cir
- 411 Hughes St
- 20 Grouse Cir
- 8 Grouse Cir
- 6 Grouse Cir
- 710 W Willow St
- 928 W Willow St
- 500 W Willow St
- 5 Grouse Cir
- 126 Creekside Dr
- 136 Creekside Dr
- Dogwood Plan at Sable Creek
Your Personal Tour Guide
Ask me questions while you tour the home.