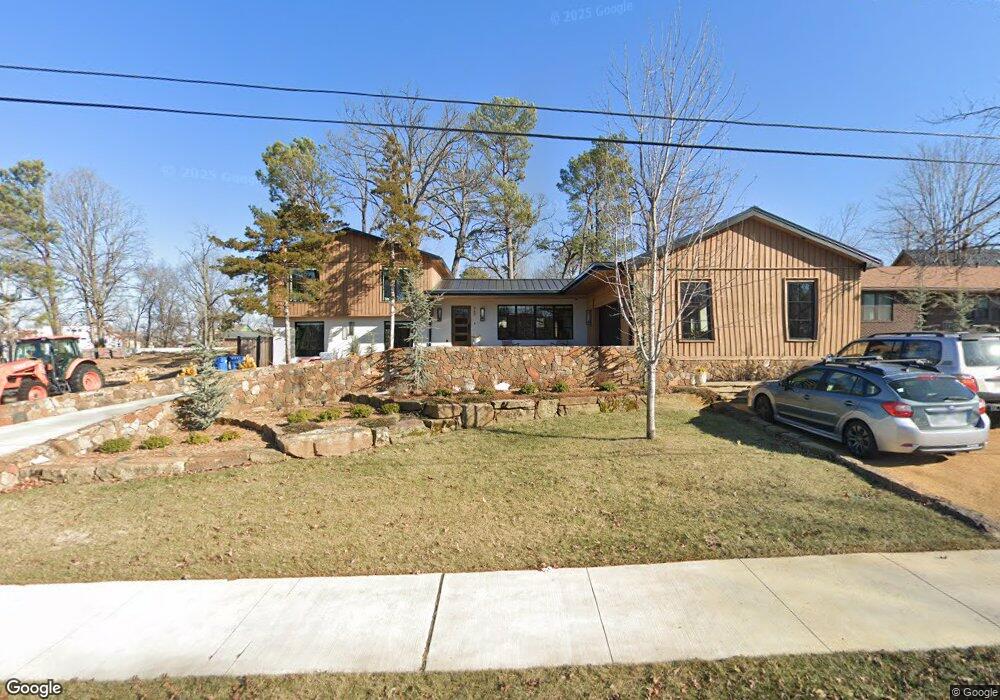
910 NW C St Bentonville, AR 72712
Estimated Value: $1,200,000 - $1,315,663
--
Bed
2
Baths
2,844
Sq Ft
$449/Sq Ft
Est. Value
About This Home
This home is located at 910 NW C St, Bentonville, AR 72712 and is currently estimated at $1,277,666, approximately $449 per square foot. 910 NW C St is a home located in Benton County with nearby schools including Sugar Creek Elementary School, Old High Middle School, and Lincoln Junior High School.
Ownership History
Date
Name
Owned For
Owner Type
Purchase Details
Closed on
Jan 7, 2025
Sold by
Bfv Bentonville Llc
Bought by
Beau S And Kourtney F Barrett Family Trust and Barrett
Current Estimated Value
Purchase Details
Closed on
Jul 24, 2020
Sold by
Marts Kent M and Marts Natalie R
Bought by
Bfv Bentonville Llc
Purchase Details
Closed on
Apr 13, 2001
Bought by
Marts
Purchase Details
Closed on
May 18, 1971
Bought by
Craig
Create a Home Valuation Report for This Property
The Home Valuation Report is an in-depth analysis detailing your home's value as well as a comparison with similar homes in the area
Home Values in the Area
Average Home Value in this Area
Purchase History
| Date | Buyer | Sale Price | Title Company |
|---|---|---|---|
| Beau S And Kourtney F Barrett Family Trust | -- | None Listed On Document | |
| Bfv Bentonville Llc | $254,000 | Citytitle & Closing Llc | |
| Marts | $115,000 | -- | |
| Craig | $3,000 | -- |
Source: Public Records
Tax History Compared to Growth
Tax History
| Year | Tax Paid | Tax Assessment Tax Assessment Total Assessment is a certain percentage of the fair market value that is determined by local assessors to be the total taxable value of land and additions on the property. | Land | Improvement |
|---|---|---|---|---|
| 2025 | $10,721 | $220,148 | $86,020 | $134,128 |
| 2024 | $10,769 | $220,148 | $86,020 | $134,128 |
| 2023 | $7,882 | $127,540 | $78,320 | $49,220 |
| 2022 | $8,073 | $127,540 | $78,320 | $49,220 |
| 2021 | $8,047 | $127,540 | $78,320 | $49,220 |
| 2020 | $2,368 | $37,170 | $3,800 | $33,370 |
| 2019 | $2,368 | $37,170 | $3,800 | $33,370 |
| 2018 | $2,357 | $37,170 | $3,800 | $33,370 |
| 2017 | $1,934 | $37,170 | $3,800 | $33,370 |
| 2016 | $1,934 | $37,170 | $3,800 | $33,370 |
| 2015 | $1,748 | $28,290 | $4,000 | $24,290 |
| 2014 | $1,748 | $28,290 | $4,000 | $24,290 |
Source: Public Records
Map
Nearby Homes