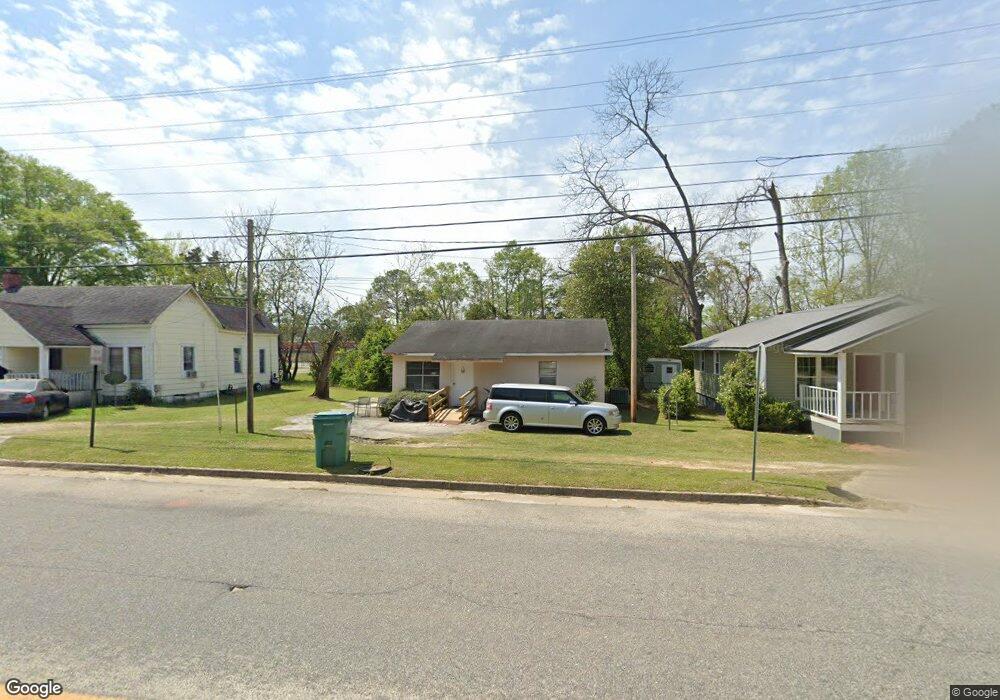
910 S 5th St Cordele, GA 31015
Estimated Value: $53,947 - $77,000
2
Beds
1
Bath
1,110
Sq Ft
$56/Sq Ft
Est. Value
About This Home
This home is located at 910 S 5th St, Cordele, GA 31015 and is currently estimated at $61,649, approximately $55 per square foot. 910 S 5th St is a home located in Crisp County with nearby schools including Crisp County Elementary School, Crisp County Primary School, and Crisp County Middle School.
Ownership History
Date
Name
Owned For
Owner Type
Purchase Details
Closed on
Sep 3, 2025
Sold by
Green April
Bought by
Dent Norma Ellen Turton and Turton Claude Shearer Tr
Current Estimated Value
Purchase Details
Closed on
Feb 13, 2024
Sold by
Lorenzo Terry Nay
Bought by
Turton William Malin and Ellen Turton Dent Norma
Purchase Details
Closed on
Jun 2, 2022
Sold by
Turton Properties
Bought by
Pittman Mojica
Home Financials for this Owner
Home Financials are based on the most recent Mortgage that was taken out on this home.
Original Mortgage
$30,144
Interest Rate
4.52%
Mortgage Type
New Conventional
Purchase Details
Closed on
Aug 5, 2005
Sold by
Turton Investments
Bought by
Turton Properties
Purchase Details
Closed on
Jul 19, 2005
Sold by
Turton Investments
Bought by
Turton Properties
Create a Home Valuation Report for This Property
The Home Valuation Report is an in-depth analysis detailing your home's value as well as a comparison with similar homes in the area
Home Values in the Area
Average Home Value in this Area
Purchase History
| Date | Buyer | Sale Price | Title Company |
|---|---|---|---|
| Dent Norma Ellen Turton | $33,463 | -- | |
| Turton William Malin | $34,042 | -- | |
| Pittman Mojica | $35,500 | -- | |
| Turton Properties | -- | -- | |
| Turton Properties | -- | -- |
Source: Public Records
Mortgage History
| Date | Status | Borrower | Loan Amount |
|---|---|---|---|
| Previous Owner | Pittman Mojica | $30,144 |
Source: Public Records
Tax History Compared to Growth
Tax History
| Year | Tax Paid | Tax Assessment Tax Assessment Total Assessment is a certain percentage of the fair market value that is determined by local assessors to be the total taxable value of land and additions on the property. | Land | Improvement |
|---|---|---|---|---|
| 2025 | $312 | $9,585 | $833 | $8,752 |
| 2024 | $312 | $8,710 | $833 | $7,877 |
| 2023 | $310 | $8,273 | $833 | $7,440 |
| 2022 | $207 | $7,835 | $833 | $7,002 |
| 2021 | $203 | $7,397 | $833 | $6,564 |
| 2020 | $208 | $7,397 | $833 | $6,564 |
| 2019 | $210 | $7,397 | $833 | $6,564 |
| 2018 | $355 | $12,028 | $1,600 | $10,428 |
| 2017 | $488 | $12,028 | $1,600 | $10,428 |
| 2016 | $356 | $12,028 | $1,600 | $10,428 |
| 2015 | -- | $12,028 | $1,600 | $10,428 |
| 2014 | -- | $12,028 | $1,600 | $10,428 |
| 2013 | -- | $12,028 | $1,600 | $10,428 |
Source: Public Records
Map
Nearby Homes