910 S Grant Blvd Unit 17 Minerva, OH 44657
Estimated Value: $159,437 - $191,000
4
Beds
2
Baths
2,805
Sq Ft
$63/Sq Ft
Est. Value
About This Home
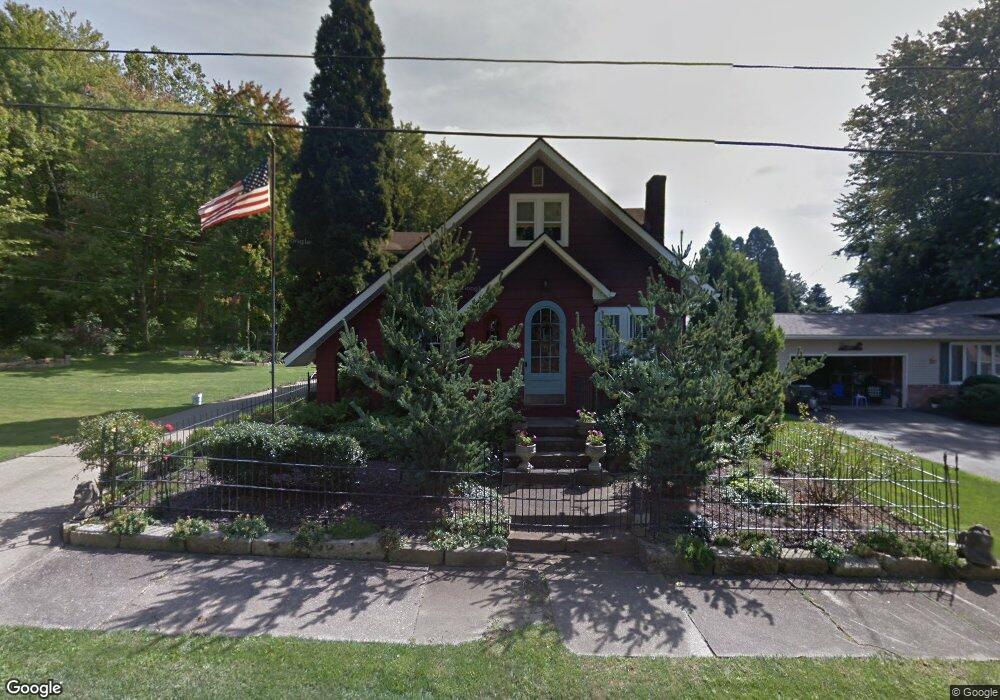
This home is located at 910 S Grant Blvd Unit 17, Minerva, OH 44657 and is currently estimated at $177,609, approximately $63 per square foot. 910 S Grant Blvd Unit 17 is a home located in Carroll County with nearby schools including Minerva Elementary School, Minerva Middle School, and Minerva High School.
Create a Home Valuation Report for This Property
The Home Valuation Report is an in-depth analysis detailing your home's value as well as a comparison with similar homes in the area
Home Values in the Area
Average Home Value in this Area
Tax History Compared to Growth
Tax History
| Year | Tax Paid | Tax Assessment Tax Assessment Total Assessment is a certain percentage of the fair market value that is determined by local assessors to be the total taxable value of land and additions on the property. | Land | Improvement |
|---|---|---|---|---|
| 2024 | $1,375 | $43,480 | $4,330 | $39,150 |
| 2023 | $1,459 | $43,480 | $4,330 | $39,150 |
| 2022 | $1,477 | $36,080 | $3,590 | $32,490 |
| 2021 | $1,205 | $36,080 | $3,590 | $32,490 |
| 2020 | $1,264 | $36,080 | $3,590 | $32,490 |
| 2019 | $1,107 | $36,082 | $3,588 | $32,494 |
| 2018 | $948 | $30,480 | $3,350 | $27,130 |
| 2017 | $975 | $30,480 | $3,350 | $27,130 |
| 2016 | $994 | $27,970 | $3,080 | $24,890 |
| 2015 | $892 | $27,970 | $3,080 | $24,890 |
| 2014 | $916 | $27,970 | $3,080 | $24,890 |
| 2013 | $916 | $27,970 | $3,080 | $24,890 |
Source: Public Records
Map
Nearby Homes
- 503 Murray Ave Unit 19
- 402 King St Unit 21
- 806 S Grant Blvd
- 203 S Main St Unit 11
- 802 Elizabeth St
- 401 Prospect St
- 0 Lynnwood Dr
- 729 Lynnwood Dr
- 701 E Lincolnway
- 113 W 1st St
- 821 Lynnwood Dr
- 9076 E Southview St Unit 35
- 0 Surrey Dr SE
- 0 Lincoln St SE
- 22141 Mcdaniel St
- 4165 Surrey Dr SE
- 10874 Minerva Blvd
- 22862 Virginia Ave
- 0 Leopard Rd NW Unit 3
- 0 Leopard Rd NW Unit 5
- 909 S Grant Blvd Unit 26
- 909 S Grant Blvd Unit 26
- 908 S Grant Blvd Unit 17
- 905 S Grant Blvd Unit 26
- 913 S Grant Blvd Unit 33
- 516 Queen St Unit 33
- 305 Walnut Place Unit 1A
- 916 S Grant Blvd Unit 17
- 901 S Grant Blvd Unit 26
- 312 Stackhouse St Unit 17
- 312 Stackhouse St Unit 17
- 312 Stackhouse St
- 512 Queen St Unit 34A
- 308 Stackhouse St Unit 17
- 324 Stackhouse St Unit 17
- 902 S Grant Blvd Unit 17
- 301 Walnut Place Unit 1A
- 521 Queen St Unit 33
- 523 Murray Ave Unit 18
- 519 Murray Ave Unit 18