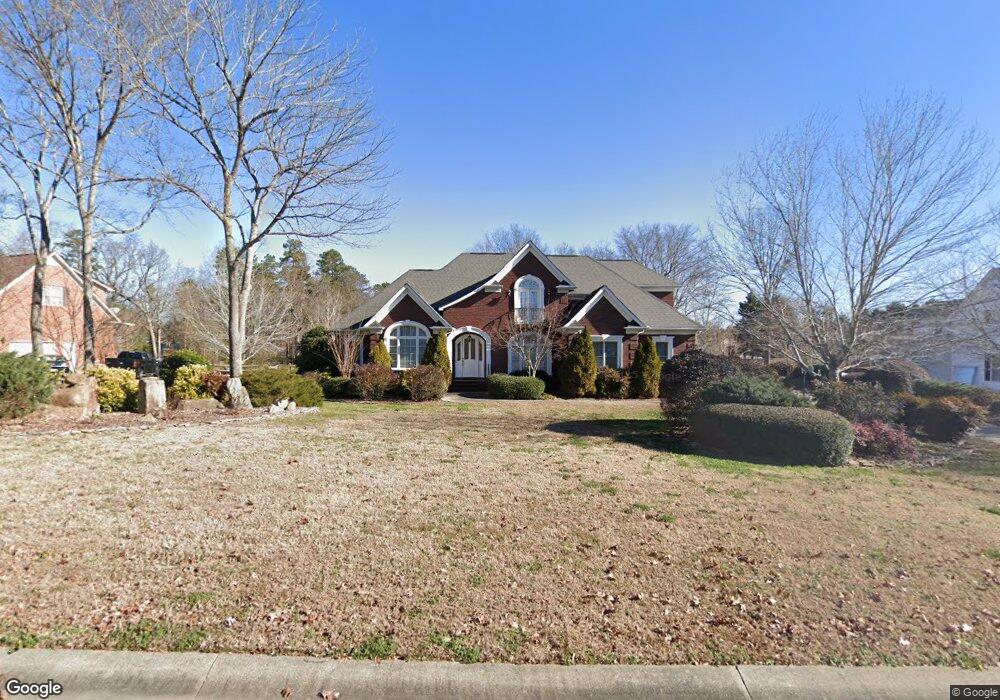
910 Woodhurst Dr Monroe, NC 28110
Estimated Value: $564,000 - $649,000
4
Beds
3
Baths
3,066
Sq Ft
$201/Sq Ft
Est. Value
About This Home
This home is located at 910 Woodhurst Dr, Monroe, NC 28110 and is currently estimated at $616,041, approximately $200 per square foot. 910 Woodhurst Dr is a home located in Union County with nearby schools including Shiloh Valley Primary School, Shiloh Valley Elementary School, and Sun Valley Middle School.
Ownership History
Date
Name
Owned For
Owner Type
Purchase Details
Closed on
Jul 15, 2009
Sold by
Underwood William L and Underwood Faye
Bought by
Zeilfelder Charles and Zeilfelder Donna
Current Estimated Value
Home Financials for this Owner
Home Financials are based on the most recent Mortgage that was taken out on this home.
Original Mortgage
$357,525
Outstanding Balance
$229,640
Interest Rate
5%
Mortgage Type
VA
Estimated Equity
$386,401
Purchase Details
Closed on
Jan 6, 2000
Sold by
Winn Brian P and Winn Janine M
Bought by
Underwood William L and Underwood Faye
Purchase Details
Closed on
Oct 19, 1998
Sold by
Gunter Richard A and Gunter Burgess G
Bought by
Winn Brian P
Home Financials for this Owner
Home Financials are based on the most recent Mortgage that was taken out on this home.
Original Mortgage
$40,500
Interest Rate
7.91%
Create a Home Valuation Report for This Property
The Home Valuation Report is an in-depth analysis detailing your home's value as well as a comparison with similar homes in the area
Home Values in the Area
Average Home Value in this Area
Purchase History
| Date | Buyer | Sale Price | Title Company |
|---|---|---|---|
| Zeilfelder Charles | $350,000 | None Available | |
| Underwood William L | $49,000 | -- | |
| Winn Brian P | $45,000 | -- |
Source: Public Records
Mortgage History
| Date | Status | Borrower | Loan Amount |
|---|---|---|---|
| Open | Zeilfelder Charles | $357,525 | |
| Previous Owner | Winn Brian P | $40,500 |
Source: Public Records
Tax History Compared to Growth
Tax History
| Year | Tax Paid | Tax Assessment Tax Assessment Total Assessment is a certain percentage of the fair market value that is determined by local assessors to be the total taxable value of land and additions on the property. | Land | Improvement |
|---|---|---|---|---|
| 2024 | $2,640 | $409,700 | $65,100 | $344,600 |
| 2023 | $2,616 | $409,700 | $65,100 | $344,600 |
| 2022 | $2,616 | $409,700 | $65,100 | $344,600 |
| 2021 | $2,610 | $409,700 | $65,100 | $344,600 |
| 2020 | $2,302 | $294,100 | $44,000 | $250,100 |
| 2019 | $2,302 | $294,100 | $44,000 | $250,100 |
| 2018 | $2,302 | $294,100 | $44,000 | $250,100 |
| 2017 | $2,432 | $294,100 | $44,000 | $250,100 |
| 2016 | $2,389 | $294,100 | $44,000 | $250,100 |
| 2015 | $2,415 | $294,100 | $44,000 | $250,100 |
| 2014 | $2,098 | $298,270 | $55,000 | $243,270 |
Source: Public Records
Map
Nearby Homes
- 5407 Berrywood Ln
- 1012 Laparc Ln
- 1013 Laparc Ln
- 1020 Laparc Ln
- 1006 Heritage Pointe
- The Wallace Plan at Heritage
- The Garland Plan at Heritage
- Sullivan Plan at Heritage - 55+ Community
- Grayson Plan at Heritage - 55+ Community
- Fenwick Plan at Heritage - 55+ Community
- Wescott Plan at Heritage - 55+ Community
- Edgefield Plan at Heritage - 55+ Community
- Stanley Plan at Heritage - 55+ Community
- Mayfair Plan at Heritage - 55+ Community
- Avery Plan at Heritage - 55+ Community
- 6750 Plain View Rd
- 3030 Bent Willow Dr
- 3049 Bent Willow Dr
- 3010 Bent Willow Dr
- 3018 Bent Willow Dr
- 908 Woodhurst Dr
- 916 Woodhurst Dr
- 1000 Brandon Ct
- 906 Woodhurst Dr
- 1001 Brandon Ct
- 911 Woodhurst Dr
- 911 Woodhurst Dr Unit 16
- 913 Woodhurst Dr
- 920 Woodhurst Dr
- 904 Woodhurst Dr
- 907 Woodhurst Dr
- 1002 Brandon Ct
- 1000 Woodhurst Dr
- 915 Woodhurst Dr
- 905 Woodhurst Dr Unit 28
- 905 Woodhurst Dr
- 905 Woodhurst Dr
- 1005 Brandon Ct
- 902 Woodhurst Dr
- 917 Woodhurst Dr