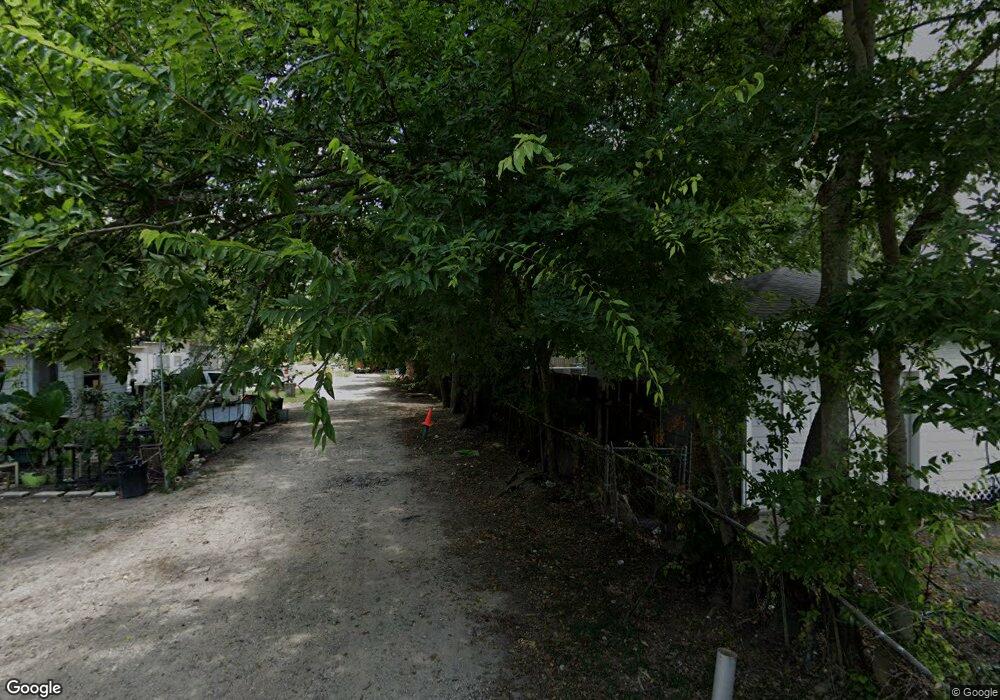
910 Woodland St Channelview, TX 77530
Estimated Value: $188,000 - $303,000
3
Beds
1
Bath
1,152
Sq Ft
$212/Sq Ft
Est. Value
About This Home
This home is located at 910 Woodland St, Channelview, TX 77530 and is currently estimated at $244,055, approximately $211 per square foot. 910 Woodland St is a home located in Harris County with nearby schools including Channelview High School.
Ownership History
Date
Name
Owned For
Owner Type
Purchase Details
Closed on
Aug 25, 2016
Sold by
Mooney Charles Nicholas and Mooney Clayton Wallace
Bought by
Ornelas Miguel
Current Estimated Value
Home Financials for this Owner
Home Financials are based on the most recent Mortgage that was taken out on this home.
Original Mortgage
$108,007
Outstanding Balance
$89,204
Interest Rate
4.62%
Mortgage Type
FHA
Estimated Equity
$154,851
Purchase Details
Closed on
Jul 11, 2010
Sold by
Stratman Gerry A and Stratman Charla K
Bought by
Mooney Charles Nicholas and Mooney Clayton Wallace
Purchase Details
Closed on
Nov 17, 2009
Sold by
Mooney Dale Lynn
Bought by
Stratmann Gerry A and Stratmann Charla K
Purchase Details
Closed on
Jun 26, 2000
Sold by
Mooney Charles S and Mooney Imogene
Bought by
Mooney Dale Lynn and Mooney Charles Nicholas
Create a Home Valuation Report for This Property
The Home Valuation Report is an in-depth analysis detailing your home's value as well as a comparison with similar homes in the area
Home Values in the Area
Average Home Value in this Area
Purchase History
| Date | Buyer | Sale Price | Title Company |
|---|---|---|---|
| Ornelas Miguel | -- | Star Tex Title Co | |
| Mooney Charles Nicholas | -- | None Available | |
| Stratmann Gerry A | -- | None Available | |
| Mooney Dale Lynn | -- | -- |
Source: Public Records
Mortgage History
| Date | Status | Borrower | Loan Amount |
|---|---|---|---|
| Open | Ornelas Miguel | $108,007 |
Source: Public Records
Tax History Compared to Growth
Tax History
| Year | Tax Paid | Tax Assessment Tax Assessment Total Assessment is a certain percentage of the fair market value that is determined by local assessors to be the total taxable value of land and additions on the property. | Land | Improvement |
|---|---|---|---|---|
| 2025 | $2,365 | $204,872 | $137,574 | $67,298 |
| 2024 | $2,365 | $180,176 | $120,377 | $59,799 |
| 2023 | $2,365 | $187,675 | $120,377 | $67,298 |
| 2022 | $3,549 | $161,514 | $103,181 | $58,333 |
| 2021 | $3,359 | $138,611 | $68,787 | $69,824 |
| 2020 | $3,335 | $129,858 | $61,908 | $67,950 |
| 2019 | $3,210 | $122,227 | $61,908 | $60,319 |
| 2018 | $1,400 | $100,306 | $34,394 | $65,912 |
| 2017 | $2,637 | $100,306 | $34,394 | $65,912 |
| 2016 | $1,876 | $71,368 | $25,795 | $45,573 |
| 2015 | $1,855 | $71,368 | $25,795 | $45,573 |
| 2014 | $1,855 | $69,103 | $25,795 | $43,308 |
Source: Public Records
Map
Nearby Homes
- 0 Laurelwood Dr Unit 43034610
- 16134 Palm St
- 16032 1/2 Ridlon St
- 1211 Pecan St
- 1109 Becker St
- 16023 Ridlon St
- 16326 Bear Bayou Dr
- 16736 Forest Trail Dr
- 16219 Bear Bayou 1 2 Dr
- 16600 Laurelwood Dr
- 00 Laurelwood Dr
- 16811 Forest Trail Dr
- 16931 Avenue B
- 16809 Market St
- 16121 Bear Bayou Dr Unit 13
- 108 Cedar Ln
- 16534 Market St
- 16516 Market St
- 17119 Water Oak Dr
- 431 Crockett St
- 910 Woodland St
- 908 Woodland St
- 912 Woodland St
- 902 Woodland St
- 916 Woodland St
- 911 Woodland St
- 924 Woodland St
- 822 Woodland St
- 909 Woodland St
- 907 Woodland St
- 919 Woodland St
- 818 Woodland St
- 1123 Red Bud St
- 932 Woodland St
- 1121 Red Bud St
- 1121 Red Bud St Unit 5
- 814 Woodland St
- 1117 Red Bud St
- 1119 Red Bud St
- 1124 Red Bud St