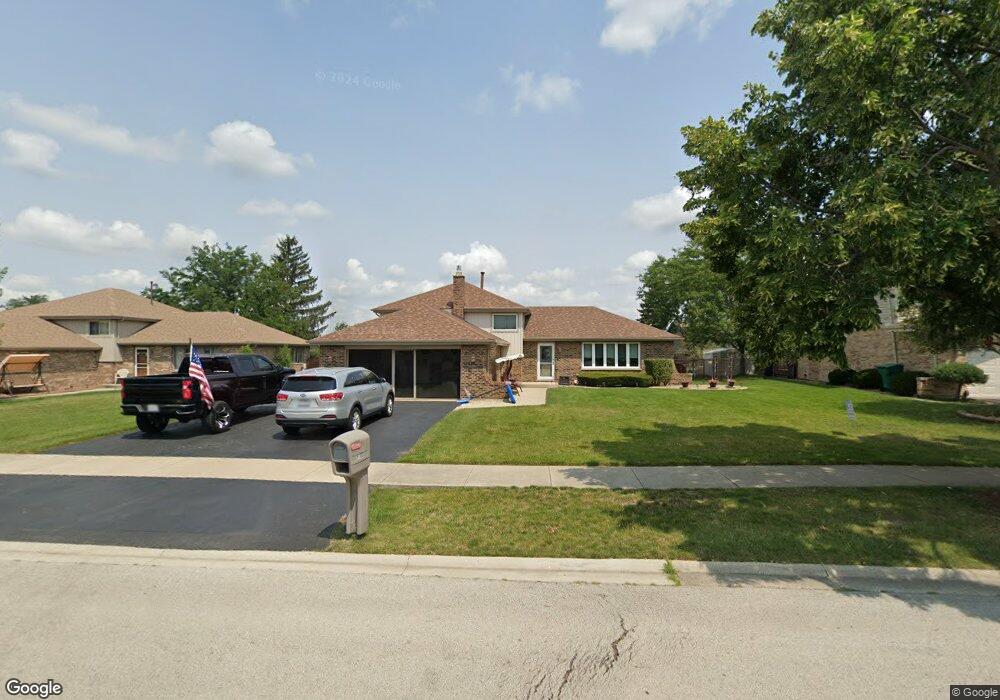
9100 Merion Dr Orland Park, IL 60462
Silver Lake South NeighborhoodEstimated Value: $408,647 - $436,000
3
Beds
2
Baths
1,499
Sq Ft
$283/Sq Ft
Est. Value
About This Home
This home is located at 9100 Merion Dr, Orland Park, IL 60462 and is currently estimated at $424,412, approximately $283 per square foot. 9100 Merion Dr is a home located in Cook County with nearby schools including Orland Center School, Liberty Elementary School, and Jerling Junior High School.
Ownership History
Date
Name
Owned For
Owner Type
Purchase Details
Closed on
Aug 11, 2014
Sold by
Jeziorny Stephen and Jeziorny Linda M
Bought by
Jeziorny Stephen and Jeziorny Linda M
Current Estimated Value
Home Financials for this Owner
Home Financials are based on the most recent Mortgage that was taken out on this home.
Original Mortgage
$165,500
Outstanding Balance
$126,146
Interest Rate
4.1%
Mortgage Type
New Conventional
Estimated Equity
$298,266
Purchase Details
Closed on
Feb 5, 2000
Sold by
Jeziorny Stephen
Bought by
Jeziorny Stephen and Jeziorny Linda M
Purchase Details
Closed on
Mar 25, 1999
Sold by
Harrison Robert H and Harrison Kathleen V
Bought by
Jeziorny Stephen
Home Financials for this Owner
Home Financials are based on the most recent Mortgage that was taken out on this home.
Original Mortgage
$199,500
Interest Rate
6.62%
Create a Home Valuation Report for This Property
The Home Valuation Report is an in-depth analysis detailing your home's value as well as a comparison with similar homes in the area
Home Values in the Area
Average Home Value in this Area
Purchase History
| Date | Buyer | Sale Price | Title Company |
|---|---|---|---|
| Jeziorny Stephen | -- | First American Title Ins Co | |
| Jeziorny Stephen | -- | -- | |
| Jeziorny Stephen | $210,000 | First American Title |
Source: Public Records
Mortgage History
| Date | Status | Borrower | Loan Amount |
|---|---|---|---|
| Open | Jeziorny Stephen | $165,500 | |
| Closed | Jeziorny Stephen | $199,500 |
Source: Public Records
Tax History Compared to Growth
Tax History
| Year | Tax Paid | Tax Assessment Tax Assessment Total Assessment is a certain percentage of the fair market value that is determined by local assessors to be the total taxable value of land and additions on the property. | Land | Improvement |
|---|---|---|---|---|
| 2024 | $6,936 | $33,682 | $6,250 | $27,432 |
| 2023 | $4,855 | $33,682 | $6,250 | $27,432 |
| 2022 | $4,855 | $22,364 | $5,500 | $16,864 |
| 2021 | $4,736 | $22,364 | $5,500 | $16,864 |
| 2020 | $4,673 | $22,364 | $5,500 | $16,864 |
| 2019 | $5,048 | $24,562 | $5,000 | $19,562 |
| 2018 | $5,640 | $24,562 | $5,000 | $19,562 |
| 2017 | $5,528 | $24,562 | $5,000 | $19,562 |
| 2016 | $5,202 | $21,139 | $4,500 | $16,639 |
| 2015 | $5,117 | $21,139 | $4,500 | $16,639 |
| 2014 | $4,829 | $22,139 | $4,500 | $17,639 |
| 2013 | $5,601 | $24,482 | $4,500 | $19,982 |
Source: Public Records
Map
Nearby Homes
- 9209 Cliffside Ln Unit 54C
- 15511 Westminster Dr Unit 65B
- 9314 Wherry Ln Unit D
- 15324 Regent Dr
- 9291 Erin Ln Unit D7
- 9350 Waterford Ln Unit C16
- 8824 Carnoustie Dr
- 15633 Orlan Brook Dr
- 15726 Orlan Brook Dr Unit 193
- 8624 Kendall Ln
- 9180 136th St
- 15713 Orlan Brook Dr Unit 98
- 56 Orland Square Dr
- 8909 Silverdale Dr Unit 5C
- 15717 Orlan Brook Dr Unit G83
- 15826 Orlan Brook Dr Unit 3S
- 9061 Somerset Ct Unit 16
- 15712 86th Ave Unit 117
- 15817 Orlan Brook Dr Unit 35
- 15233 Lawrence Ct
- 9060 Merion Dr
- 9110 Merion Dr
- 9101 Wheeler Dr
- 9111 Wheeler Dr
- 9061 Wheeler Dr
- 9050 Merion Dr
- 9120 Merion Dr
- 9101 Merion Dr
- 9121 Wheeler Dr
- 15530 Dewberry Ln
- 9051 Wheeler Dr
- 9111 Merion Dr
- 9040 Merion Dr
- 9130 Merion Dr
- 9121 Merion Dr
- 9131 Wheeler Dr
- 15550 Dewberry Ln
- 9041 Wheeler Dr
- 9100 Dewberry Ln
- 15436 Sheffield Ln