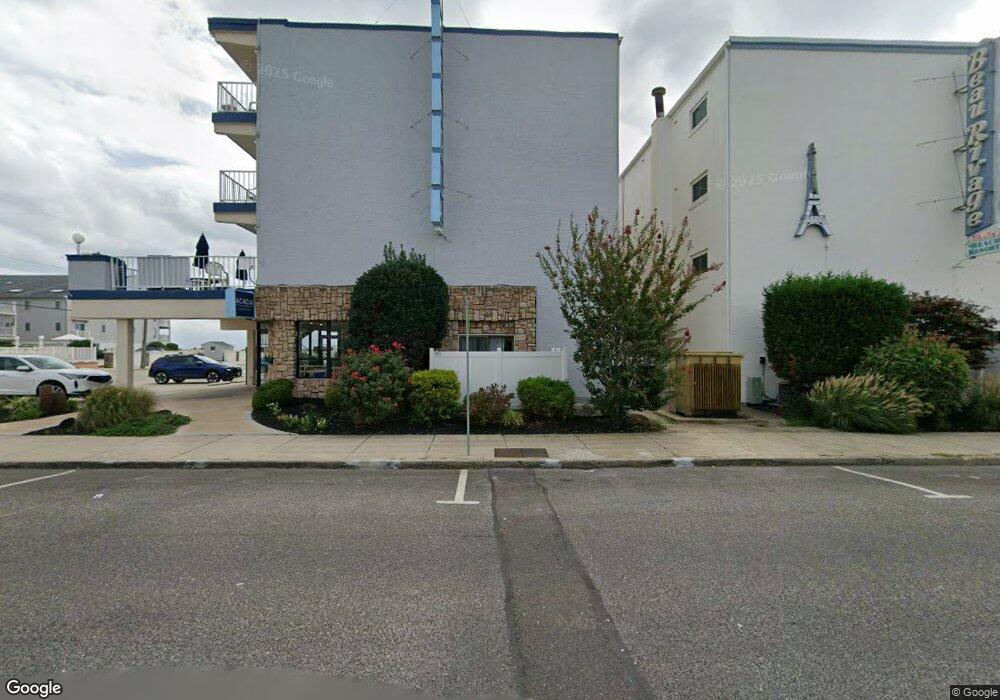
9101 Atlantic Ave Wildwood, NJ 08260
The Wildwoods NeighborhoodEstimated Value: $251,000 - $304,409
--
Bed
--
Bath
470
Sq Ft
$606/Sq Ft
Est. Value
About This Home
This home is located at 9101 Atlantic Ave, Wildwood, NJ 08260 and is currently estimated at $284,602, approximately $605 per square foot. 9101 Atlantic Ave is a home located in Cape May County with nearby schools including Crest Memorial School, Wildwood Catholic Academy, and Wildwood Catholic High School.
Ownership History
Date
Name
Owned For
Owner Type
Purchase Details
Closed on
Dec 10, 2024
Sold by
Overton Mark S and Overton Stacey L
Bought by
Derubeis Aldo V and Derubeis Elizabeth
Current Estimated Value
Home Financials for this Owner
Home Financials are based on the most recent Mortgage that was taken out on this home.
Original Mortgage
$210,000
Outstanding Balance
$208,287
Interest Rate
6.6%
Mortgage Type
New Conventional
Estimated Equity
$76,315
Purchase Details
Closed on
Nov 4, 2021
Sold by
Linzey Ronald F
Bought by
Overton Mark S and Overton Stacey L
Purchase Details
Closed on
Sep 19, 2008
Sold by
Linzey Ronald F
Bought by
Shearn Karen A
Purchase Details
Closed on
Jul 20, 2006
Sold by
Linzey Ronald F
Bought by
Linzey Ronald F and Shearn Karen A
Create a Home Valuation Report for This Property
The Home Valuation Report is an in-depth analysis detailing your home's value as well as a comparison with similar homes in the area
Home Values in the Area
Average Home Value in this Area
Purchase History
| Date | Buyer | Sale Price | Title Company |
|---|---|---|---|
| Derubeis Aldo V | $285,000 | First American Title | |
| Derubeis Aldo V | $285,000 | First American Title | |
| Overton Mark S | $169,900 | Shore Title | |
| Shearn Karen A | -- | None Available | |
| Linzey Ronald F | -- | None Available |
Source: Public Records
Mortgage History
| Date | Status | Borrower | Loan Amount |
|---|---|---|---|
| Open | Derubeis Aldo V | $210,000 | |
| Closed | Derubeis Aldo V | $210,000 |
Source: Public Records
Tax History Compared to Growth
Tax History
| Year | Tax Paid | Tax Assessment Tax Assessment Total Assessment is a certain percentage of the fair market value that is determined by local assessors to be the total taxable value of land and additions on the property. | Land | Improvement |
|---|---|---|---|---|
| 2025 | $2,424 | $169,900 | $125,000 | $44,900 |
| 2024 | $2,424 | $169,900 | $125,000 | $44,900 |
| 2023 | $2,389 | $169,900 | $125,000 | $44,900 |
| 2022 | $2,530 | $185,200 | $140,000 | $45,200 |
| 2021 | $2,456 | $185,200 | $140,000 | $45,200 |
| 2020 | $2,387 | $185,200 | $140,000 | $45,200 |
| 2019 | $2,369 | $185,200 | $140,000 | $45,200 |
| 2018 | $2,330 | $185,200 | $140,000 | $45,200 |
| 2017 | $2,284 | $185,200 | $140,000 | $45,200 |
| 2016 | $2,211 | $185,200 | $140,000 | $45,200 |
| 2015 | $2,178 | $185,200 | $140,000 | $45,200 |
| 2014 | $2,130 | $185,200 | $140,000 | $45,200 |
Source: Public Records
Map
Nearby Homes
- 9103 Atlantic Ave Unit 405
- 9103 Atlantic Ave Unit 411
- 9103 Atlantic Ave Unit 202
- 9101 Atlantic Ave Unit 303
- 9101 Atlantic Ave Unit 306
- 8901 Atlantic Ave Unit 601
- 8901 Atlantic Ave Unit 604
- 9601 Atlantic Ave Unit 604
- 9601 Atlantic Ave Unit 1208
- 301 E Rochester Ave Unit 412
- 309 E Hollywood Ave Unit 3
- 9500 Seaview Ave
- 209 E Pittsburgh Ave
- 8401 Atlantic Ave Unit 103
- 8401 Atlantic Ave Unit 322
- 122 E Charleston Ave
- 422 E Toledo Ave
- 524 Turtle Gut Cir Unit 524
- 116 E Rochester Ave Unit 116
- 114 E Rochester Ave Unit 114
- 9101 Atlantic Ave Unit 214
- 9101 Atlantic Ave Unit 301
- 9101 Atlantic Ave
- 9101 Atlantic Ave Unit 407
- 9101 Atlantic Ave Unit 310
- 9101 Atlantic Ave
- 9101 Atlantic Ave
- 9101 Atlantic Ave
- 9101 Atlantic Ave
- 9101 Atlantic Ave
- 9101 Atlantic Ave
- 9101 Atlantic Ave
- 9101 Atlantic Ave
- 9101 Atlantic Ave
- 9101 Atlantic Ave
- 9101 Atlantic Ave
- 9101 Atlantic Ave
- 9101 Atlantic Ave
- 9101 Atlantic Ave
- 9101 Atlantic Ave