
Seller's Agent in 2020
Jodie Struebing
KW Platinum
(586) 915-9915
1 in this area
91 Total Sales
Estimated Value: $512,000 - $611,000
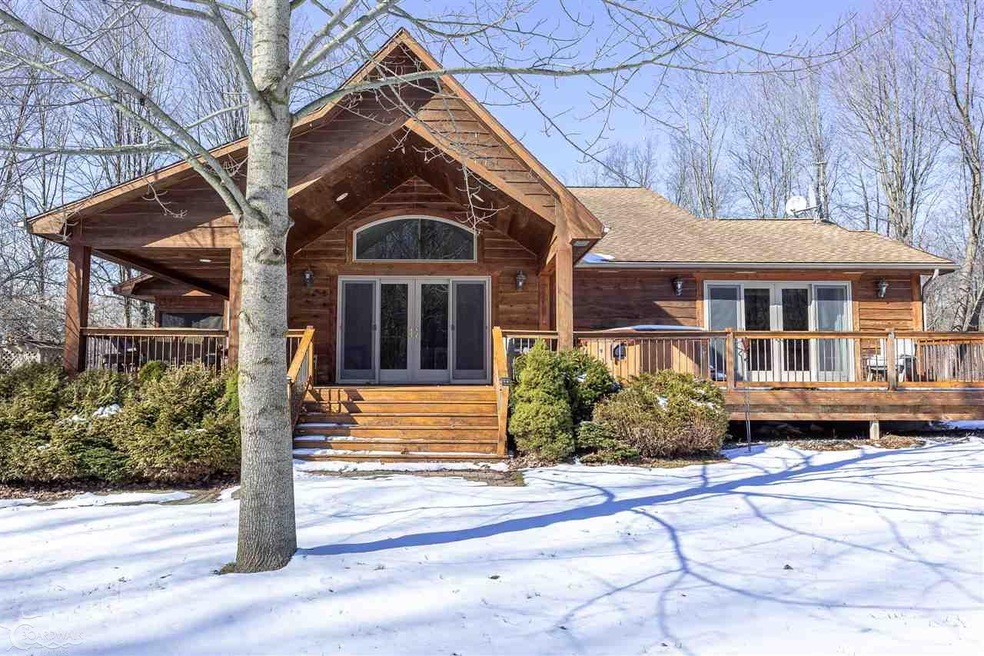
Country living with all City amenities! 10.78 secluded acres on paved street, city water & natural gas! Spectacular Cedar home (recently sealed) Vaulted Great room w/wood burning stove, Eucalyptus hardwood flooring, remodeled kitchen w/granite counters & walk in pantry. Vaulted Family/Billiard room w/French doors (2003), Vaulted master over looks the property & pond, 19'x6' master closet! Master bath w/Jacuzzi tub, marble lite counters, double sinks & 6 shower heads! New carpet upstairs! All baths are amazing! Furnace 03, central air is less then 1 yr, roof 03, Anderson windows & doorwalls, 800 sq' wrap around deck + 500 sq' side deck. Paver patio w/fire pit. 1500 sq.' Pole Barn with electricity, water, 220 and cement floor! Appliances Neg. Paved driveway. Hot tub included. Shed on side of house and club house that has electricity.
Last Agent to Sell the Property
KW Platinum License #MISPE-6506046111 Listed on: 02/18/2020
Last Buyer's Agent
Danielle Boulier
Sine & Monaghan Realtors Real Living LLC SC License #RCO-6501377923
| Date | Buyer | Sale Price | Title Company |
|---|---|---|---|
| Romain Rodney R | $400,000 | Bell Title |
| Date | Event | Price | List to Sale | Price per Sq Ft |
|---|---|---|---|---|
| 03/17/2020 03/17/20 | Sold | $400,000 | -6.8% | $145 / Sq Ft |
| 02/29/2020 02/29/20 | Pending | -- | -- | -- |
| 02/26/2020 02/26/20 | Price Changed | $429,000 | -2.3% | $156 / Sq Ft |
| 02/18/2020 02/18/20 | For Sale | $439,000 | -- | $159 / Sq Ft |
| Year | Tax Paid | Tax Assessment Tax Assessment Total Assessment is a certain percentage of the fair market value that is determined by local assessors to be the total taxable value of land and additions on the property. | Land | Improvement |
|---|---|---|---|---|
| 2025 | $4,945 | $303,500 | $0 | $0 |
| 2024 | $4,852 | $298,000 | $0 | $0 |
| 2023 | $4,674 | $246,300 | $0 | $0 |
| 2022 | $7,690 | $229,700 | $0 | $0 |
| 2020 | $3,734 | $163,300 | $163,300 | $0 |
| 2019 | $4,284 | $142,900 | $0 | $0 |
| 2018 | $4,240 | $133,600 | $0 | $0 |
| 2017 | $3,946 | $123,300 | $0 | $0 |
| 2016 | $1,927 | $123,300 | $0 | $0 |
| 2015 | -- | $111,600 | $111,600 | $0 |
| 2014 | -- | $102,400 | $102,400 | $0 |
| 2013 | -- | $97,800 | $0 | $0 |
Seller's Agent in 2020
Jodie Struebing
KW Platinum
(586) 915-9915
1 in this area
91 Total Sales
D
Buyer's Agent in 2020
Danielle Boulier
Sine & Monaghan Realtors Real Living LLC SC
Source: Michigan Multiple Listing Service
MLS Number: 50006059
APN: 14-541-0076-000
Disclaimer: Certain information contained herein is derived from information provided by parties other than Homes.com. All information provided is deemed reliable, but is not guaranteed to be accurate and should be independently verified.
![]() Source MLS: MiRealSource
Source MLS: MiRealSource
Provided through IDX via MiRealSource. Courtesy of MiRealSource Shareholder. Copyright MiRealSource.
The information published and disseminated by MiRealSource is communicated verbatim, without change by MiRealSource, as filed with MiRealSource by its members. The accuracy of all information, regardless of source, is not guaranteed or warranted. All information should be independently verified.
Copyright 2026 MiRealSource. All rights reserved. The information provided hereby constitutes proprietary information of MiRealSource, Inc. and its shareholders, affiliates and licensees and may not be reproduced or transmitted in any form or by any means, electronic or mechanical, including photocopy, recording, scanning or any information storage and retrieval system, without written permission from MiRealSource, Inc.
Ask me questions while you tour the home.