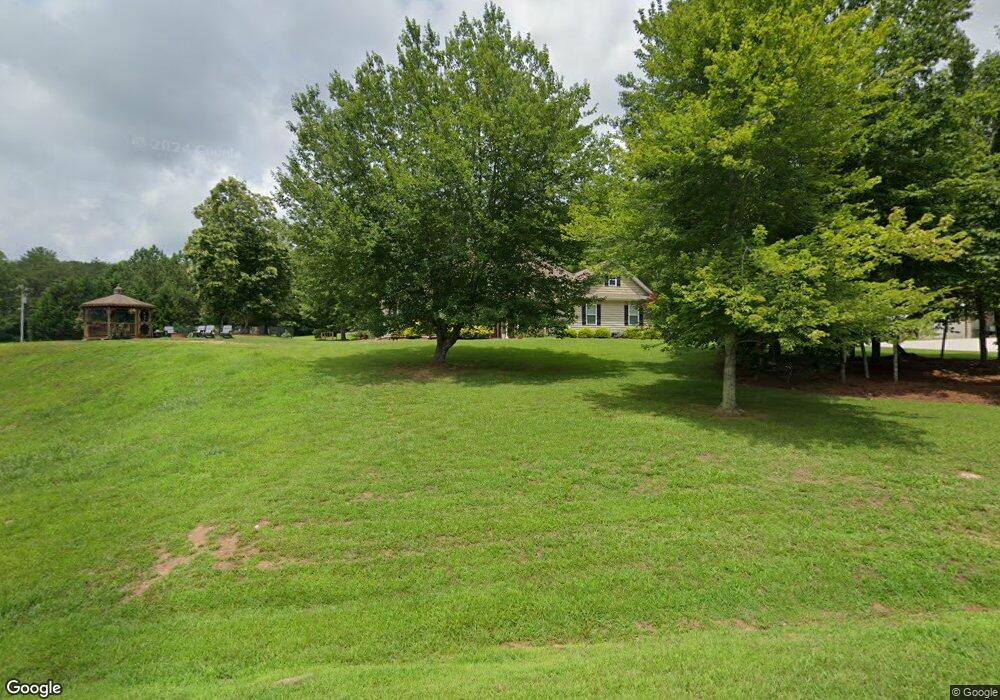
9101 Roy Rd Ellijay, GA 30536
Estimated Value: $553,000 - $738,000
--
Bed
--
Bath
2,655
Sq Ft
$246/Sq Ft
Est. Value
About This Home
This home is located at 9101 Roy Rd, Ellijay, GA 30536 and is currently estimated at $652,802, approximately $245 per square foot. 9101 Roy Rd is a home with nearby schools including Ellijay Elementary School, Clear Creek Elementary School, and Gilmer Middle School.
Ownership History
Date
Name
Owned For
Owner Type
Purchase Details
Closed on
Sep 22, 2014
Sold by
Bartlett Susan M
Bought by
Bartlett Fam Ellijay Llc
Current Estimated Value
Home Financials for this Owner
Home Financials are based on the most recent Mortgage that was taken out on this home.
Original Mortgage
$140,000
Outstanding Balance
$76,163
Interest Rate
4.15%
Mortgage Type
New Conventional
Estimated Equity
$576,639
Purchase Details
Closed on
Jan 21, 2013
Sold by
Bartlett Fam Ellijay Ll
Bought by
Bartlett Susan M
Purchase Details
Closed on
Nov 20, 2012
Sold by
Pritchett Keith
Bought by
Bartlett Fam Ellijay Llc
Purchase Details
Closed on
Sep 15, 2006
Sold by
Wingate Lafayette and Wingate Cherrie
Bought by
Pritchett Keith and Pritchett Carol J
Purchase Details
Closed on
Oct 27, 1999
Sold by
Reece Bj
Bought by
Pritchett Keith and Pritchett Carol J
Create a Home Valuation Report for This Property
The Home Valuation Report is an in-depth analysis detailing your home's value as well as a comparison with similar homes in the area
Home Values in the Area
Average Home Value in this Area
Purchase History
| Date | Buyer | Sale Price | Title Company |
|---|---|---|---|
| Bartlett Fam Ellijay Llc | -- | -- | |
| Bartlett Susan M | -- | -- | |
| Bartlett Fam Ellijay Llc | $290,000 | -- | |
| Pritchett Keith | -- | -- | |
| Pritchett Keith | $70,000 | -- |
Source: Public Records
Mortgage History
| Date | Status | Borrower | Loan Amount |
|---|---|---|---|
| Open | Bartlett Fam Ellijay Llc | $140,000 |
Source: Public Records
Tax History Compared to Growth
Tax History
| Year | Tax Paid | Tax Assessment Tax Assessment Total Assessment is a certain percentage of the fair market value that is determined by local assessors to be the total taxable value of land and additions on the property. | Land | Improvement |
|---|---|---|---|---|
| 2025 | $3,475 | $225,772 | $11,480 | $214,292 |
| 2024 | $3,475 | $224,268 | $9,960 | $214,308 |
| 2023 | $3,552 | $222,108 | $7,800 | $214,308 |
| 2022 | $3,205 | $182,108 | $5,600 | $176,508 |
| 2021 | $2,874 | $144,828 | $4,920 | $139,908 |
| 2020 | $2,773 | $126,076 | $4,800 | $121,276 |
| 2019 | $2,855 | $126,076 | $4,800 | $121,276 |
| 2018 | $2,852 | $124,340 | $4,800 | $119,540 |
| 2017 | $2,527 | $102,712 | $4,800 | $97,912 |
| 2016 | $2,613 | $104,080 | $4,800 | $99,280 |
| 2015 | $2,479 | $100,552 | $5,760 | $94,792 |
| 2014 | $2,075 | $80,960 | $5,760 | $75,200 |
| 2013 | -- | $86,280 | $5,760 | $80,520 |
Source: Public Records
Map
Nearby Homes
- 10712 Doublehead Gap Rd
- 108 Red Hawk Trail
- 17 AC McGruder Rd
- 0 Possum Poke Rd Unit 29 10584394
- 19.44 Mt McGurder Rd
- 34 Garrett Branch Cir
- Lot 33 E Ridge Ln
- 17.67 Rainbow Ridge Dr
- 17.67 AC Rainbow Ridge Dr
- Lot 32 E Ridge Ln
- 20 AC Hidaway Dr
- Lt 51,53 Squirrel Hunting Rd
- LT 51, 53 Squirrel Hunting Rd
- Lot 40 Squirrel Hunting Rd
- LOT 42 Squirrel Hunting Rd
- 0 Garrett Branch Cir
- 0 Rd Unit 7631544
- 0 Squirrel Hunting Rd Unit 10587950
- 940 Fowler Rd
- 55 Tickanetley Ln
- 8979 Roy Rd
- 8998 Roy Rd
- 9121 Roy Rd
- 9219 Roy Rd
- 271 Branch Way
- 240 Branch Way
- 135 Branch Way
- 8909 Roy Rd
- 8904 Roy Rd
- Lot 24 Branch Way
- 10837 Doublehead Gap Rd
- 330 Branch Way
- 0 Branch Way
- TR 11 Branch Way
- 10821 Doublehead Gap Rd
- 518 Old Orchard Rd
- 518 Old Orchard Rd
- 399 Branch Way
- 399 Branch Way
- 0 Roy Rd