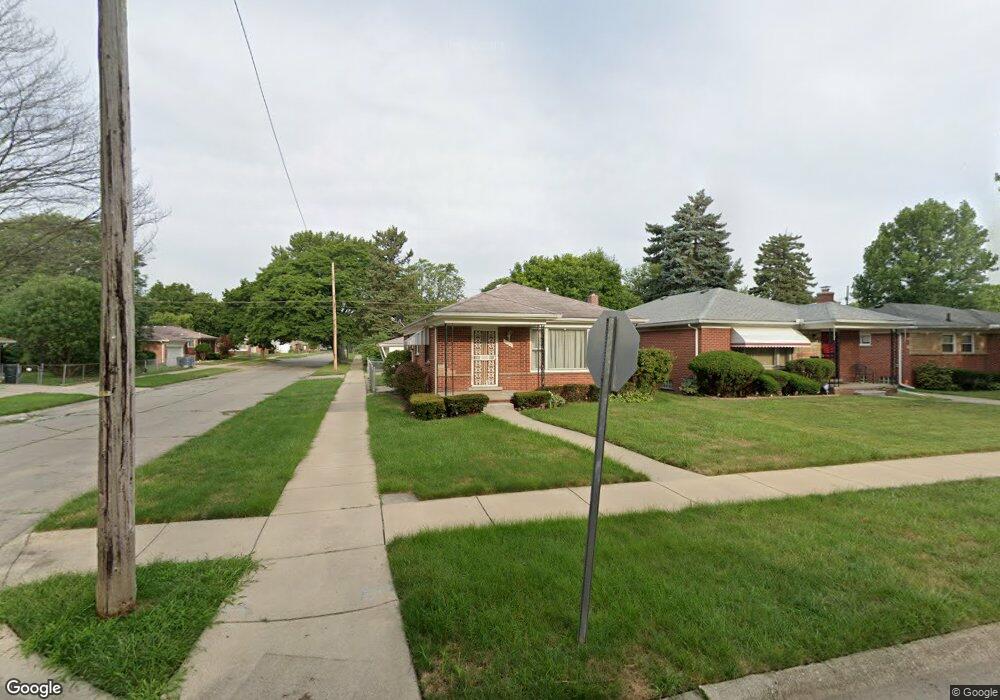
9101 Virgil Redford, MI 48239
Estimated Value: $167,000 - $214,000
3
Beds
1
Bath
1,054
Sq Ft
$178/Sq Ft
Est. Value
About This Home
This home is located at 9101 Virgil, Redford, MI 48239 and is currently estimated at $187,442, approximately $177 per square foot. 9101 Virgil is a home located in Wayne County with nearby schools including John D. Pierce Middle School, Lee M. Thurston High School, and Global Heights Academy.
Ownership History
Date
Name
Owned For
Owner Type
Purchase Details
Closed on
Oct 17, 2011
Sold by
Fannie Mae
Bought by
Purry Joann
Current Estimated Value
Purchase Details
Closed on
Nov 11, 2009
Sold by
Midfirst Bank
Bought by
Federal National Mortgage Association
Purchase Details
Closed on
Nov 4, 2009
Sold by
Kelly Frank and Kelly Addie M
Bought by
Midfirst Bank
Purchase Details
Closed on
Nov 30, 1995
Sold by
Frank Kelly
Bought by
Frank Kelly
Create a Home Valuation Report for This Property
The Home Valuation Report is an in-depth analysis detailing your home's value as well as a comparison with similar homes in the area
Home Values in the Area
Average Home Value in this Area
Purchase History
| Date | Buyer | Sale Price | Title Company |
|---|---|---|---|
| Purry Joann | $27,900 | None Available | |
| Federal National Mortgage Association | -- | None Available | |
| Midfirst Bank | $116,897 | None Available | |
| Frank Kelly | $79,000 | -- |
Source: Public Records
Tax History Compared to Growth
Tax History
| Year | Tax Paid | Tax Assessment Tax Assessment Total Assessment is a certain percentage of the fair market value that is determined by local assessors to be the total taxable value of land and additions on the property. | Land | Improvement |
|---|---|---|---|---|
| 2025 | $619 | $79,400 | $0 | $0 |
| 2024 | $619 | $70,700 | $0 | $0 |
| 2023 | $592 | $60,900 | $0 | $0 |
| 2022 | $1,781 | $51,900 | $0 | $0 |
| 2021 | $1,731 | $49,700 | $0 | $0 |
| 2020 | $1,708 | $44,100 | $0 | $0 |
| 2019 | $1,672 | $33,400 | $0 | $0 |
| 2018 | $533 | $27,900 | $0 | $0 |
| 2017 | $1,845 | $25,600 | $0 | $0 |
| 2016 | $1,438 | $24,000 | $0 | $0 |
| 2015 | $2,240 | $22,400 | $0 | $0 |
| 2013 | $2,330 | $23,800 | $0 | $0 |
| 2012 | $3,764 | $26,300 | $5,500 | $20,800 |
Source: Public Records
Map
Nearby Homes