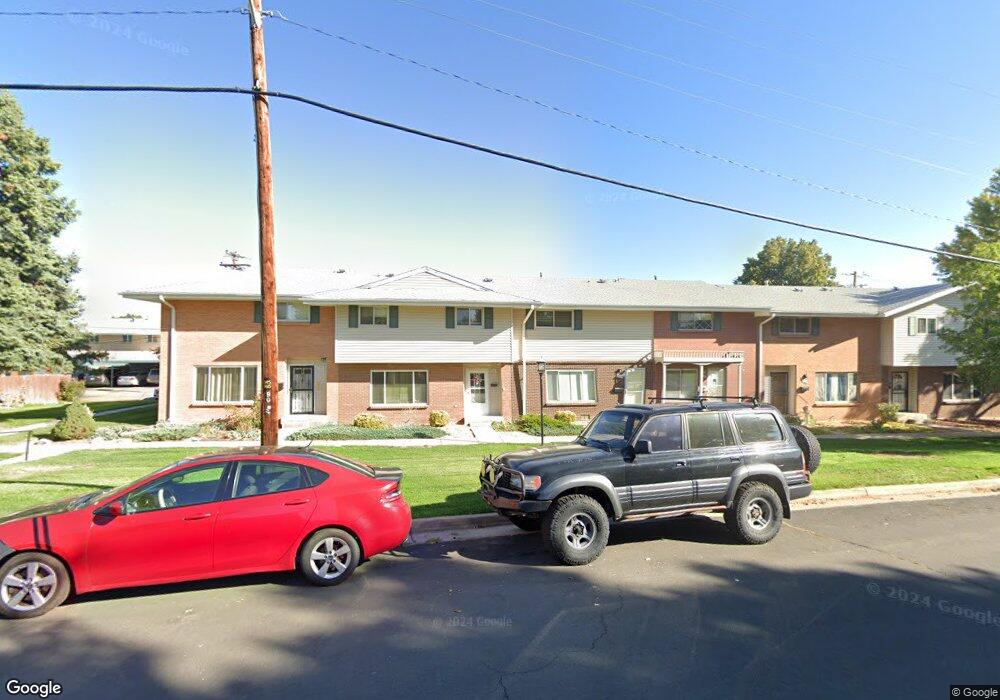
9103 E Mansfield Ave Unit 88 Denver, CO 80237
Hampden South NeighborhoodEstimated Value: $359,000 - $373,000
4
Beds
3
Baths
1,584
Sq Ft
$232/Sq Ft
Est. Value
About This Home
This home is located at 9103 E Mansfield Ave Unit 88, Denver, CO 80237 and is currently estimated at $367,193, approximately $231 per square foot. 9103 E Mansfield Ave Unit 88 is a home located in Denver County with nearby schools including Samuels Elementary School, Holm Elementary School, and Joe Shoemaker School.
Ownership History
Date
Name
Owned For
Owner Type
Purchase Details
Closed on
Apr 9, 2021
Sold by
Andemariam Genet G
Bought by
Andemariam Genet
Current Estimated Value
Home Financials for this Owner
Home Financials are based on the most recent Mortgage that was taken out on this home.
Original Mortgage
$130,000
Outstanding Balance
$97,396
Interest Rate
2.9%
Mortgage Type
New Conventional
Estimated Equity
$269,797
Purchase Details
Closed on
Oct 24, 2005
Sold by
Vansickle Chris
Bought by
Andemariam Genet G
Purchase Details
Closed on
Sep 9, 2004
Sold by
Bzdek James and Frank Susan
Bought by
Vansickle Chris
Purchase Details
Closed on
Sep 30, 1999
Sold by
Frank Susan K
Bought by
Frank Susan and Bzdek James
Home Financials for this Owner
Home Financials are based on the most recent Mortgage that was taken out on this home.
Original Mortgage
$63,000
Interest Rate
7.83%
Create a Home Valuation Report for This Property
The Home Valuation Report is an in-depth analysis detailing your home's value as well as a comparison with similar homes in the area
Home Values in the Area
Average Home Value in this Area
Purchase History
| Date | Buyer | Sale Price | Title Company |
|---|---|---|---|
| Andemariam Genet | -- | Capital Title | |
| Andemariam Genet G | $164,900 | Security Title | |
| Vansickle Chris | $81,767 | -- | |
| Frank Susan | -- | -- |
Source: Public Records
Mortgage History
| Date | Status | Borrower | Loan Amount |
|---|---|---|---|
| Open | Andemariam Genet | $130,000 | |
| Previous Owner | Frank Susan | $63,000 |
Source: Public Records
Tax History Compared to Growth
Tax History
| Year | Tax Paid | Tax Assessment Tax Assessment Total Assessment is a certain percentage of the fair market value that is determined by local assessors to be the total taxable value of land and additions on the property. | Land | Improvement |
|---|---|---|---|---|
| 2024 | $1,739 | $21,960 | $2,930 | $19,030 |
| 2023 | $1,702 | $21,960 | $2,930 | $19,030 |
| 2022 | $1,765 | $22,190 | $3,040 | $19,150 |
| 2021 | $1,765 | $22,820 | $3,120 | $19,700 |
| 2020 | $1,501 | $20,230 | $3,130 | $17,100 |
| 2019 | $1,459 | $20,230 | $3,130 | $17,100 |
| 2018 | $1,276 | $16,490 | $3,150 | $13,340 |
| 2017 | $1,272 | $16,490 | $3,150 | $13,340 |
| 2016 | $1,161 | $14,240 | $3,073 | $11,167 |
| 2015 | $1,113 | $14,240 | $3,073 | $11,167 |
| 2014 | $860 | $10,360 | $4,370 | $5,990 |
Source: Public Records
Map
Nearby Homes
- 9145 E Mansfield Ave
- 9264 E Mansfield Ave Unit 309
- 9149 E Mansfield Ave
- 3806 S Yosemite St Unit 144
- 9089 E Nassau Ave Unit 356
- 3981 S Boston St Unit 286
- 9079 E Nassau Ave
- 9255 E Lehigh Ave Unit 194
- 9255 E Lehigh Ave Unit 208
- 9175 E Oxford Dr Unit 638
- 3852 S Dallas St Unit 8107
- 9481 E Mansfield Ave Unit 305
- 3771 S Dayton St
- 3875 S Dayton St Unit 307
- 3680 S Beeler St Unit 5
- 3751 S Dayton St
- 3890 S Dayton St Unit 203
- 8659 E Kenyon Ave
- 3720 S Willow Cir
- 8292 E Lehigh Dr
- 9105 E Mansfield Ave Unit 87
- 9117 E Mansfield Ave
- 9107 E Mansfield Ave Unit 86
- 9109 E Mansfield Ave Unit 85
- 9111 E Mansfield Ave
- 9127 E Mansfield Ave
- 9113 E Mansfield Ave Unit 83
- 9043 E Mansfield Ave Unit 105
- 9130 E Mansfield Ave Unit 487
- 9202 E Mansfield Ave
- 9133 E Mansfield Ave Unit 81
- 9041 E Mansfield Ave Unit 106
- 9132 E Mansfield Ave
- 9204 E Mansfield Ave Unit 226
- 9206 E Mansfield Ave
- 9208 E Mansfield Ave Unit 224
- 9153 E Mansfield Ave Unit 77
- 9136 E Mansfield Ave Unit 484
- 9112 E Mansfield Ave Unit 479
- 9121 E Mansfield Ave