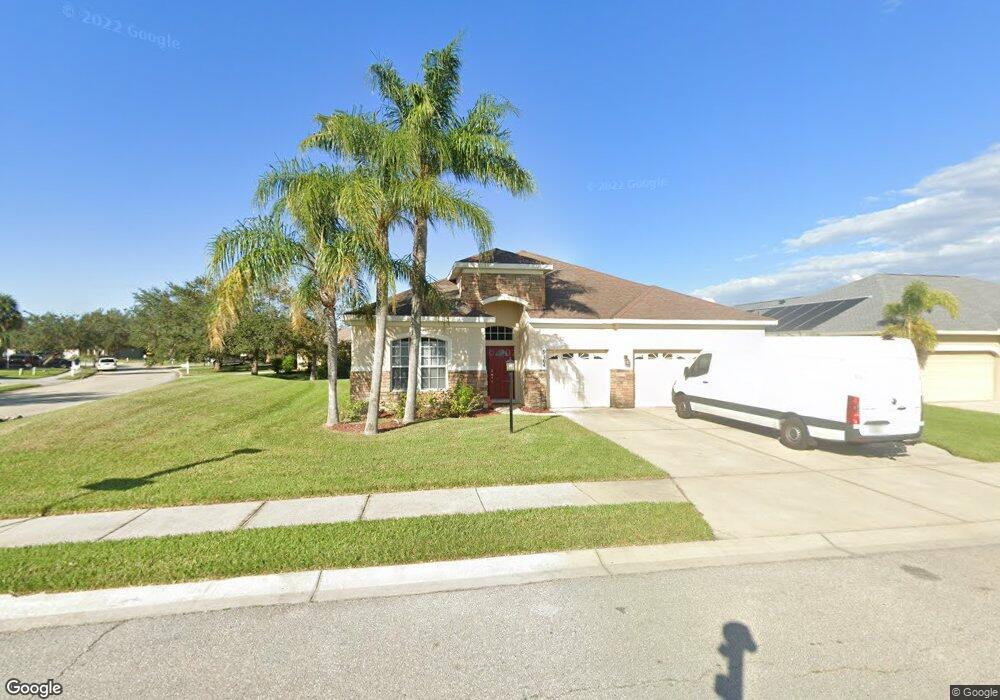
9104 63rd Ct E Parrish, FL 34219
Estimated Value: $464,260 - $554,000
About This Home
Please note, our homes are available on a first-come, first-serve basis and are not reserved until the lease is signed by all applicants and security deposits are collected.
Interested in this home? You clearly have exceptional taste. This charming 4-bedroom, 3.0-bathroom home is not only pet-friendly, but also equipped with smart home features to make everyday life more convenient and connected. Homes like this don’t stay on the market for long—don’t miss your chance to make it yours. Apply today!
The Homeowners Association (HOA) for this home may have a separate application process that applicants will need to complete in addition to Progress Residential’s application. This may involve registering with the HOA, completing its approval process, and paying any required fees. You may also be subject to following additional HOA rules or restrictions.
Some images have been virtually staged to help showcase the potential of spaces in the home. The furnishings shown are for illustrative purposes only and are not included in the home.
Ownership History
We collect this data history from publicly available records. To have your information removed, we recommend requesting removal directly through your county’s website.
Purchase Details
Purchase Details
Home Financials for this Owner
Home Financials are based on the most recent Mortgage that was taken out on this home.Purchase Details
Purchase Details
Home Financials for this Owner
Home Financials are based on the most recent Mortgage that was taken out on this home.Purchase Details
Home Financials for this Owner
Home Financials are based on the most recent Mortgage that was taken out on this home.Purchase Details
Home Values in the Area
Average Home Value in this Area
Purchase History
We collect this data history from publicly available records. To have your information removed, we recommend requesting removal directly through your county’s website.
| Date | Buyer | Sale Price | Title Company |
|---|---|---|---|
| $240,000 | Paramount Title | ||
| $160,000 | Attorney | ||
| $132,600 | Attorney | ||
| $320,000 | Sunbelt Title Agency | ||
| $252,000 | Atlantic Land & Title Co | ||
| $100,300 | -- |
Mortgage History
We collect this data history from publicly available records. To have your information removed, we recommend requesting removal directly through your county’s website.
| Date | Status | Borrower | Loan Amount |
|---|---|---|---|
| Previous Owner | $152,762 | ||
| Previous Owner | $320,000 | ||
| Previous Owner | $226,791 |
Property History
We collect this data history from publicly available records. To have your information removed, we recommend requesting removal directly through your county’s website.
| Date | Event | Price | List to Sale | Price per Sq Ft |
|---|---|---|---|---|
| 06/19/2026 06/19/26 | Off Market | $2,785 | -- | -- |
| 06/15/2026 06/15/26 | Price Changed | $2,785 | +0.2% | $1 / Sq Ft |
| 06/14/2026 06/14/26 | Price Changed | $2,780 | +0.2% | $1 / Sq Ft |
| 06/13/2026 06/13/26 | Price Changed | $2,775 | -2.5% | $1 / Sq Ft |
| 06/12/2026 06/12/26 | For Rent | $2,845 | 0.0% | -- |
| 06/11/2026 06/11/26 | Off Market | $2,845 | -- | -- |
| 06/06/2026 06/06/26 | Price Changed | $2,845 | +1.8% | $1 / Sq Ft |
| 06/05/2026 06/05/26 | For Rent | $2,795 | 0.0% | -- |
| 06/05/2026 06/05/26 | Off Market | $2,795 | -- | -- |
| 06/01/2026 06/01/26 | Price Changed | $2,795 | +2.4% | $1 / Sq Ft |
| 05/29/2026 05/29/26 | Price Changed | $2,730 | +0.6% | $1 / Sq Ft |
| 05/28/2026 05/28/26 | Price Changed | $2,715 | 0.0% | $1 / Sq Ft |
| 05/28/2026 05/28/26 | For Rent | $2,715 | +0.9% | -- |
| 05/16/2026 05/16/26 | Off Market | $2,690 | -- | -- |
| 05/12/2026 05/12/26 | Price Changed | $2,690 | +0.7% | $1 / Sq Ft |
| 05/08/2026 05/08/26 | Price Changed | $2,670 | -1.5% | $1 / Sq Ft |
| 05/07/2026 05/07/26 | Price Changed | $2,710 | -0.6% | $1 / Sq Ft |
| 04/30/2026 04/30/26 | Price Changed | $2,725 | -1.1% | $1 / Sq Ft |
| 04/29/2026 04/29/26 | Price Changed | $2,755 | -0.9% | $1 / Sq Ft |
| 04/23/2026 04/23/26 | Price Changed | $2,780 | -0.7% | $1 / Sq Ft |
| 04/20/2026 04/20/26 | Price Changed | $2,800 | -0.7% | $1 / Sq Ft |
| 04/18/2026 04/18/26 | Price Changed | $2,820 | +0.2% | $1 / Sq Ft |
| 04/16/2026 04/16/26 | Price Changed | $2,815 | +0.2% | $1 / Sq Ft |
| 04/15/2026 04/15/26 | Price Changed | $2,810 | -0.9% | $1 / Sq Ft |
| 04/14/2026 04/14/26 | Price Changed | $2,835 | -0.2% | $1 / Sq Ft |
| 04/12/2026 04/12/26 | Price Changed | $2,840 | +0.2% | $1 / Sq Ft |
| 04/04/2026 04/04/26 | Price Changed | $2,835 | -1.0% | $1 / Sq Ft |
| 04/03/2026 04/03/26 | Price Changed | $2,865 | -1.0% | $1 / Sq Ft |
| 03/16/2026 03/16/26 | Price Changed | $2,895 | 0.0% | $1 / Sq Ft |
| 03/16/2026 03/16/26 | For Rent | $2,895 | +1.0% | -- |
| 04/08/2025 04/08/25 | Off Market | $2,865 | -- | -- |
| 04/01/2025 04/01/25 | Price Changed | $2,865 | -3.0% | $1 / Sq Ft |
| 03/31/2025 03/31/25 | Price Changed | $2,955 | -2.0% | $1 / Sq Ft |
| 03/21/2025 03/21/25 | Price Changed | $3,015 | -2.0% | $1 / Sq Ft |
| 03/19/2025 03/19/25 | Price Changed | $3,075 | -5.1% | $1 / Sq Ft |
| 03/12/2025 03/12/25 | For Rent | $3,240 | 0.0% | -- |
| 03/12/2025 03/12/25 | Price Changed | $3,240 | -24.8% | $1 / Sq Ft |
| 11/05/2024 11/05/24 | Off Market | $4,310 | -- | -- |
| 10/29/2024 10/29/24 | For Rent | $4,310 | -- | -- |
Tax History
We collect this data history from publicly available records. To have your information removed, we recommend requesting removal directly through your county’s website.
| Year | Tax Paid | Tax Assessment Tax Assessment Total Assessment is a certain percentage of the fair market value that is determined by local assessors to be the total taxable value of land and additions on the property. | Land | Improvement |
|---|---|---|---|---|
| 2025 | $6,167 | $431,096 | -- | -- |
| 2023 | $6,167 | $520,516 | $40,800 | $479,716 |
| 2022 | $5,536 | $453,053 | $40,000 | $413,053 |
| 2021 | $4,254 | $294,444 | $30,000 | $264,444 |
| 2020 | $4,153 | $273,493 | $30,000 | $243,493 |
| 2019 | $4,097 | $266,940 | $30,000 | $236,940 |
| 2018 | $4,073 | $262,103 | $30,000 | $232,103 |
| 2017 | $3,547 | $239,104 | $0 | $0 |
| 2016 | $3,703 | $251,379 | $0 | $0 |
| 2015 | $3,123 | $228,955 | $0 | $0 |
| 2014 | $3,123 | $200,764 | $0 | $0 |
| 2013 | $2,865 | $179,254 | $21,150 | $158,104 |
Map
- 9110 64th Ct E
- 6215 90th Avenue Cir E
- 9215 63rd Ct E
- 5323 90th Avenue Cir E
- 6112 90th Avenue Cir E
- 9625 Erie Rd
- 5822 100th Ave E
- 9419 54th Ct E
- 8928 Deep Horizon Loop
- 8924 Deep Horizon Loop
- 9246 Deep Horizon Loop
- 9250 Deep Horizon Loop
- 5628 82nd Ave E
- 9799 50th Street Cir E
- 7910 Palm Paradise Place
- 9724 50th Street Cir E
- 9830 50th Street Cir E
- 9927 Johnson Oaks Glen
- 7914 Palm Paradise Place
- 5539 105th Terrace E
- 6320 91st Ave E
- 6324 91st Ave E
- 6316 91st Ave E
- 7007 E 64th Ave
- 9111 64th Ct E
- 6319 91st Ave E Unit 1
- 9104 63rd Ct E
- 6315 91st Ave E
- 6323 91st Ave E
- 9115 64th Ct E
- 9108 63rd Ct E
- 9106 64th Ct E
- 6311 91st Ave E
- 9119 64th Ct E
- 9114 64th Ct E
- 6405 91st Ave E
- 9118 64th Ct E
- 6410 91st Ave E
- 6307 91st Ave E
- 9116 63rd Ct E
Ask me questions while you tour the home.