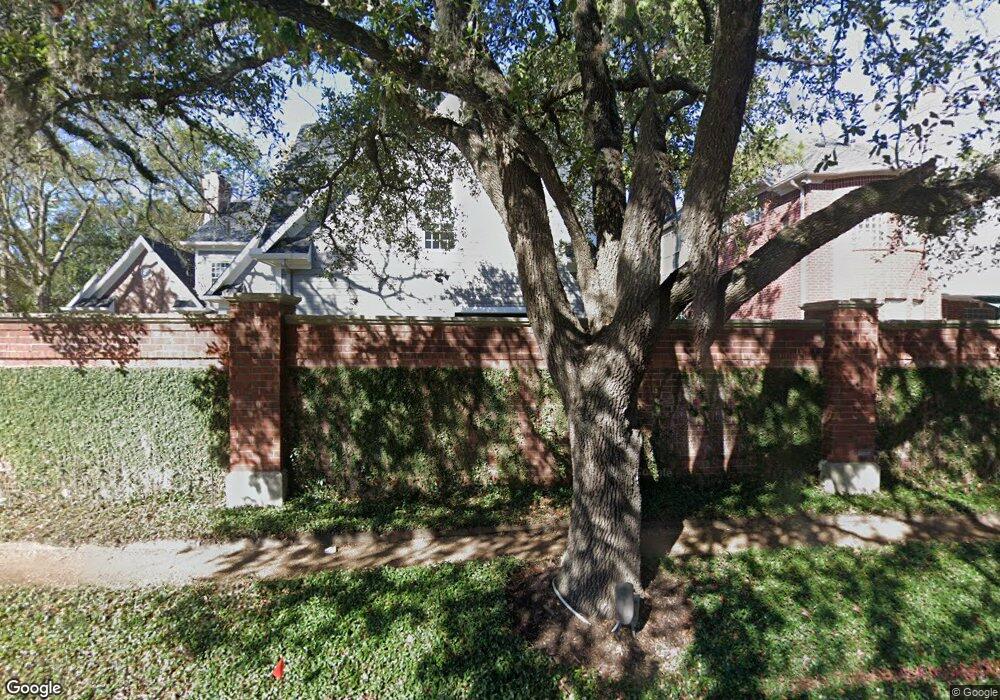
9106 Hudson Ct Houston, TX 77024
Memorial NeighborhoodEstimated Value: $1,334,000 - $1,457,000
4
Beds
5
Baths
4,135
Sq Ft
$336/Sq Ft
Est. Value
About This Home
This home is located at 9106 Hudson Ct, Houston, TX 77024 and is currently estimated at $1,388,377, approximately $335 per square foot. 9106 Hudson Ct is a home located in Harris County with nearby schools including Memorial Middle, Memorial High School, and St. Francis Episcopal School.
Ownership History
Date
Name
Owned For
Owner Type
Purchase Details
Closed on
Apr 23, 2015
Sold by
Cao Nannan
Bought by
West Scott B and Dempsey Laurence I
Current Estimated Value
Home Financials for this Owner
Home Financials are based on the most recent Mortgage that was taken out on this home.
Original Mortgage
$1,015,150
Interest Rate
3.84%
Mortgage Type
New Conventional
Purchase Details
Closed on
Oct 30, 2008
Sold by
Ham Peter and Ham Tamara
Bought by
Cao Nannan
Purchase Details
Closed on
Sep 15, 2000
Sold by
Ream James B and Ream Laurinda M
Bought by
Ham Peter and Ham Tamara
Home Financials for this Owner
Home Financials are based on the most recent Mortgage that was taken out on this home.
Original Mortgage
$508,000
Interest Rate
7.87%
Purchase Details
Closed on
Jul 31, 1998
Sold by
Narayana Narayana P and Narayana Meera
Bought by
Ream James B and Ream Laurinda M
Home Financials for this Owner
Home Financials are based on the most recent Mortgage that was taken out on this home.
Original Mortgage
$426,800
Interest Rate
6.94%
Create a Home Valuation Report for This Property
The Home Valuation Report is an in-depth analysis detailing your home's value as well as a comparison with similar homes in the area
Home Values in the Area
Average Home Value in this Area
Purchase History
| Date | Buyer | Sale Price | Title Company |
|---|---|---|---|
| West Scott B | -- | Chicago Title | |
| Cao Nannan | -- | Stewart Title Company | |
| Ham Peter | -- | First American Title | |
| Ream James B | -- | Commonwealth Land Title Co |
Source: Public Records
Mortgage History
| Date | Status | Borrower | Loan Amount |
|---|---|---|---|
| Closed | West Scott B | $1,015,150 | |
| Previous Owner | Ham Peter | $508,000 | |
| Previous Owner | Ream James B | $426,800 |
Source: Public Records
Tax History Compared to Growth
Tax History
| Year | Tax Paid | Tax Assessment Tax Assessment Total Assessment is a certain percentage of the fair market value that is determined by local assessors to be the total taxable value of land and additions on the property. | Land | Improvement |
|---|---|---|---|---|
| 2025 | $17,776 | $1,192,596 | $553,795 | $638,801 |
| 2024 | $17,776 | $1,275,233 | $553,795 | $721,438 |
| 2023 | $17,776 | $1,275,233 | $553,795 | $721,438 |
| 2022 | $29,814 | $1,275,233 | $553,795 | $721,438 |
| 2021 | $31,678 | $1,297,484 | $503,450 | $794,034 |
| 2020 | $32,510 | $1,297,484 | $503,450 | $794,034 |
| 2019 | $33,968 | $1,297,484 | $503,450 | $794,034 |
| 2018 | $12,700 | $1,297,484 | $503,450 | $794,034 |
| 2017 | $33,943 | $1,297,484 | $503,450 | $794,034 |
| 2016 | $33,943 | $1,297,484 | $503,450 | $794,034 |
| 2015 | $19,639 | $1,267,088 | $503,450 | $763,638 |
| 2014 | $19,639 | $932,157 | $453,105 | $479,052 |
Source: Public Records
Map
Nearby Homes
- 251 Sugarberry Cir
- 9400 Doliver Dr Unit 70
- 9400 Doliver Dr Unit 12
- 9400 Doliver Dr Unit 36
- 9400 Doliver Dr Unit 56
- 9171 Briar Forest Dr
- 9109 Briar Forest Dr
- 22 Sugarberry Cir
- 148 Sugarberry Cir
- 45 Patti Lynn Ln
- 9518 Bayou Brook St
- 31 Knipp Rd
- 14 1/2 W Shady Ln
- 2003 Arrowwood Cir N
- 11711 Memorial Dr Unit 570
- 11711 Memorial Dr Unit 55
- 11711 Memorial Dr Unit 21
- 11711 Memorial Dr Unit 565
- 11711 Memorial Dr Unit 695
- 11711 Memorial Dr Unit 644
- 9110 Hudson Ct
- 9102 Hudson Ct
- 9202 Hudson Ct
- 9107 Hudson Ct
- 9103 Hudson Ct
- 263 Sugarberry Cir
- 259 Sugarberry Cir
- 257 Sugarberry Cir
- 265 Sugarberry Cir
- 9203 Hudson Ct
- 9206 Hudson Ct
- 267 Sugarberry Cir
- 9207 Hudson Ct
- 253 Sugarberry Cir
- 269 Sugarberry Cir
- 9210 Hudson Ct
- 271 Sugarberry Cir
- 9013 Briar Forest Dr
- 249 Sugarberry Cir
- 9011 Briar Forest Dr