9106 N Elm St Spokane, WA 99208
Five Mile Prairie NeighborhoodEstimated Value: $401,000 - $419,635
3
Beds
2
Baths
1,184
Sq Ft
$347/Sq Ft
Est. Value
About This Home
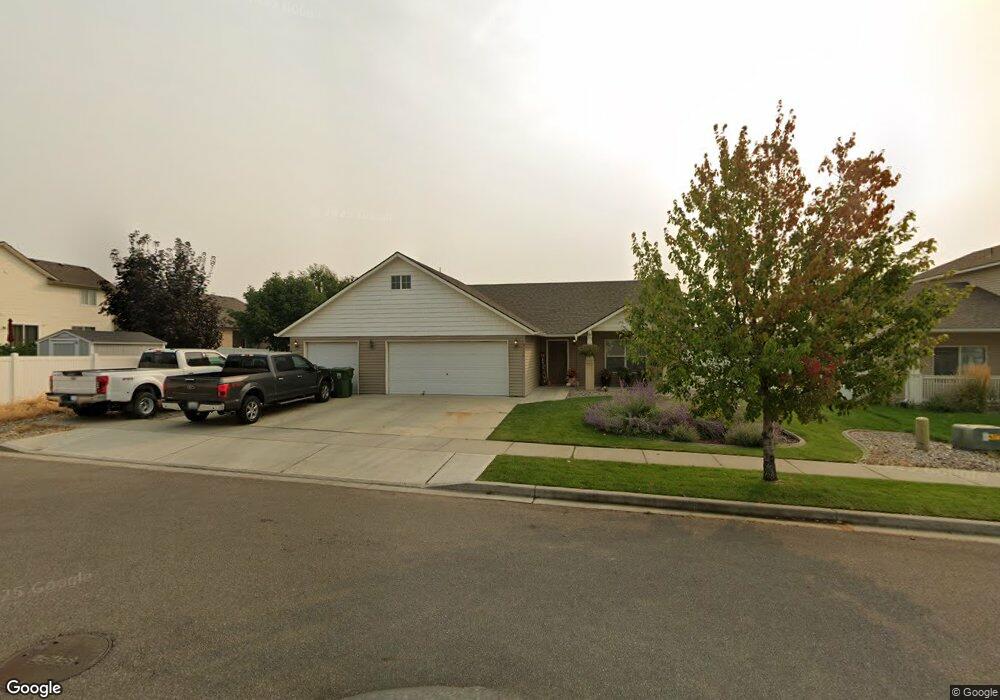
This home is located at 9106 N Elm St, Spokane, WA 99208 and is currently estimated at $410,909, approximately $347 per square foot. 9106 N Elm St is a home located in Spokane County with nearby schools including Prairie View Elementary School, Northwood Middle School, and Mead Senior High School.
Ownership History
Date
Name
Owned For
Owner Type
Purchase Details
Closed on
Nov 25, 2009
Sold by
The Lighthouse Group Inc
Bought by
Burgener Ronald C
Current Estimated Value
Home Financials for this Owner
Home Financials are based on the most recent Mortgage that was taken out on this home.
Original Mortgage
$132,884
Outstanding Balance
$86,586
Interest Rate
4.88%
Mortgage Type
New Conventional
Estimated Equity
$324,323
Purchase Details
Closed on
Sep 28, 2009
Sold by
Inland Pacific Development Llc
Bought by
Inland Pacific Development Llc
Home Financials for this Owner
Home Financials are based on the most recent Mortgage that was taken out on this home.
Original Mortgage
$132,884
Outstanding Balance
$86,586
Interest Rate
4.88%
Mortgage Type
New Conventional
Estimated Equity
$324,323
Purchase Details
Closed on
Sep 25, 2009
Sold by
Inland Pacific Development Llc
Bought by
Lighthouse Group Inc
Purchase Details
Closed on
Jan 22, 2008
Sold by
Black Realty Inc
Bought by
Rt Development Llc
Create a Home Valuation Report for This Property
The Home Valuation Report is an in-depth analysis detailing your home's value as well as a comparison with similar homes in the area
Home Values in the Area
Average Home Value in this Area
Purchase History
| Date | Buyer | Sale Price | Title Company |
|---|---|---|---|
| Burgener Ronald C | $166,108 | Inland Professional Title Ll | |
| Inland Pacific Development Llc | -- | None Available | |
| Lighthouse Group Inc | $44,750 | Inland Professional Title Ll | |
| Rt Development Llc | -- | Transnation Title Ins Co |
Source: Public Records
Mortgage History
| Date | Status | Borrower | Loan Amount |
|---|---|---|---|
| Open | Burgener Ronald C | $132,884 |
Source: Public Records
Tax History Compared to Growth
Tax History
| Year | Tax Paid | Tax Assessment Tax Assessment Total Assessment is a certain percentage of the fair market value that is determined by local assessors to be the total taxable value of land and additions on the property. | Land | Improvement |
|---|---|---|---|---|
| 2025 | $3,566 | $382,100 | $125,000 | $257,100 |
| 2024 | $3,566 | $364,900 | $100,000 | $264,900 |
| 2023 | $3,234 | $374,500 | $92,000 | $282,500 |
| 2022 | $2,944 | $360,400 | $92,000 | $268,400 |
| 2021 | $2,687 | $248,000 | $50,000 | $198,000 |
| 2020 | $2,530 | $220,300 | $42,000 | $178,300 |
| 2019 | $2,245 | $200,200 | $42,000 | $158,200 |
| 2018 | $2,319 | $176,600 | $42,000 | $134,600 |
| 2017 | $2,085 | $160,000 | $42,000 | $118,000 |
| 2016 | $2,123 | $156,900 | $42,000 | $114,900 |
| 2015 | $2,026 | $154,200 | $38,000 | $116,200 |
| 2014 | -- | $153,900 | $38,000 | $115,900 |
| 2013 | -- | $0 | $0 | $0 |
Source: Public Records
Map
Nearby Homes
- 1720 W Briar Ln
- 1708 W Cimarron Ln
- 8811 N Elm St
- 1607 W Tieton Ave
- 1601 Kedlin Ln
- 9003 N Hazelnut St Unit 1/1 Timberline
- 8516 N Summerhill Ln
- 2021 W Walker Ave
- 2077 W Walker Ave
- 8409 N Maple Ln
- 8416 N Summerhill Ln
- 8404 N Summerhill Ln
- 1833 W Windflower Ct
- 1615 W Carolina Way
- 8315 N Northview Rd
- 2804 W Johannsen Rd
- NKA N Mountain View Ln Unit Parcel 36193.9064
- 8407 N Carolina Way
- 1525 W Carl J Ln
- 7909 N Ash Ln