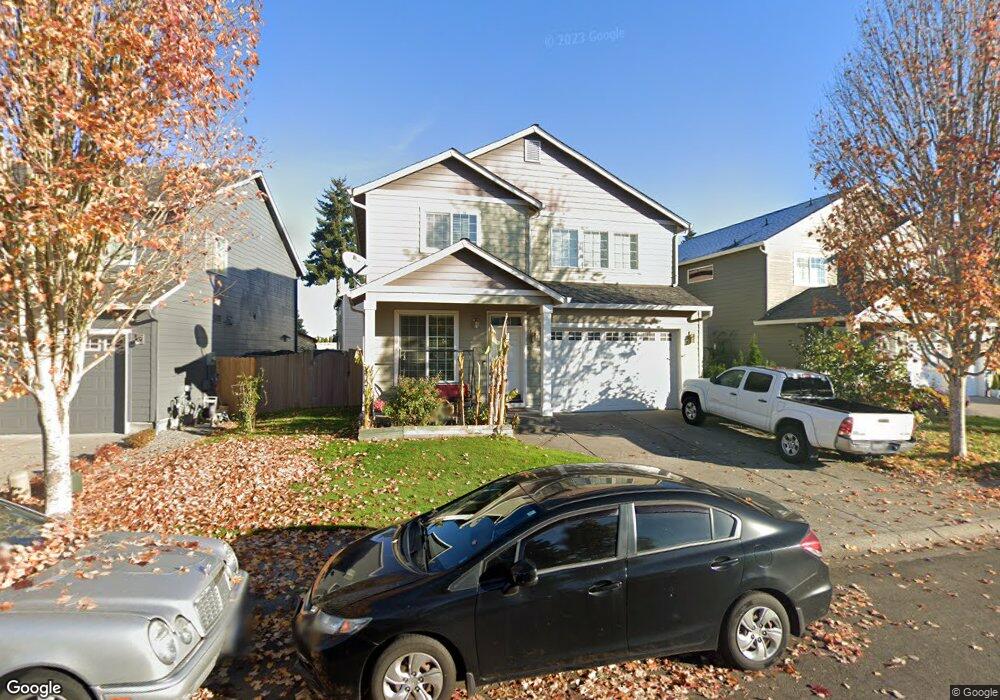
9106 NE 81st St Vancouver, WA 98662
Estimated Value: $501,000 - $559,000
4
Beds
3
Baths
2,130
Sq Ft
$248/Sq Ft
Est. Value
About This Home
This home is located at 9106 NE 81st St, Vancouver, WA 98662 and is currently estimated at $529,127, approximately $248 per square foot. 9106 NE 81st St is a home located in Clark County with nearby schools including Sunset Elementary School, Covington Middle School, and Heritage High School.
Ownership History
Date
Name
Owned For
Owner Type
Purchase Details
Closed on
Jun 9, 2006
Sold by
Rockford Homes Inc
Bought by
Chahan Mike and Chahan Boua
Current Estimated Value
Home Financials for this Owner
Home Financials are based on the most recent Mortgage that was taken out on this home.
Original Mortgage
$62,465
Interest Rate
6.55%
Mortgage Type
Stand Alone Second
Purchase Details
Closed on
Mar 2, 2006
Sold by
Eversun Llc
Bought by
Rockford Homes Inc
Home Financials for this Owner
Home Financials are based on the most recent Mortgage that was taken out on this home.
Original Mortgage
$243,460
Interest Rate
6.04%
Mortgage Type
Purchase Money Mortgage
Create a Home Valuation Report for This Property
The Home Valuation Report is an in-depth analysis detailing your home's value as well as a comparison with similar homes in the area
Home Values in the Area
Average Home Value in this Area
Purchase History
| Date | Buyer | Sale Price | Title Company |
|---|---|---|---|
| Chahan Mike | $312,325 | First American Title | |
| Rockford Homes Inc | $82,107 | First American Title |
Source: Public Records
Mortgage History
| Date | Status | Borrower | Loan Amount |
|---|---|---|---|
| Closed | Chahan Mike | $62,465 | |
| Open | Chahan Mike | $234,240 | |
| Previous Owner | Rockford Homes Inc | $243,460 |
Source: Public Records
Tax History Compared to Growth
Tax History
| Year | Tax Paid | Tax Assessment Tax Assessment Total Assessment is a certain percentage of the fair market value that is determined by local assessors to be the total taxable value of land and additions on the property. | Land | Improvement |
|---|---|---|---|---|
| 2025 | $4,731 | $463,897 | $145,200 | $318,697 |
| 2024 | $4,584 | $465,757 | $145,200 | $320,557 |
| 2023 | $4,495 | $473,636 | $145,200 | $328,436 |
| 2022 | $4,070 | $457,262 | $145,200 | $312,062 |
| 2021 | $3,869 | $385,364 | $123,200 | $262,164 |
| 2020 | $3,621 | $344,547 | $110,000 | $234,547 |
| 2019 | $3,247 | $323,601 | $104,500 | $219,101 |
| 2018 | $3,600 | $313,066 | $0 | $0 |
| 2017 | $3,294 | $280,612 | $0 | $0 |
| 2016 | $3,079 | $268,087 | $0 | $0 |
| 2015 | $3,081 | $229,492 | $0 | $0 |
| 2014 | -- | $218,805 | $0 | $0 |
| 2013 | -- | $180,512 | $0 | $0 |
Source: Public Records
Map
Nearby Homes
- 9217 NE 81st Loop
- 9604 NE 83rd Cir
- 8800 NE 82nd St
- 8003 NE 87th Ave
- 9011 NE 89th Cir
- 9006 NE 89th Cir
- 8406 NE 105th Ave
- 7618 NE Meadows Dr
- 6906 NE 90th Ave
- 8111 NE 88th St
- 10611 NE 85th Cir
- 8615 NE 69th St
- 7817 NE 107th Ave
- 8305 NE 71st St
- 10507 NE 90th St
- 9610 NE 87th Ave
- 10703 NE 70th St
- 8520 NE 111th Ave
- 10008 NE 92nd Ave
- 10418 NE 66th St
- 9200 NE 81st St
- 9102 NE 81st St
- 9204 NE 81st St
- 9111 NE 81st Loop
- 9201 NE 81st Loop
- 8012 NE 92nd Ave
- 9205 NE 81st Loop
- 9208 NE 81st St
- 8019 NE 91st Ave
- 9209 NE 81st Loop
- 9108 NE 81st Loop
- 9104 NE 81st Loop
- 9209 NE 81st Lp
- 8008 NE 92nd Ave
- 9112 NE 81st Loop
- 9203 NE 81st St
- 9212 NE 81st St
- 9100 NE 81st Loop
- 8015 NE 91st Ave
- 9213 NE 81st Loop