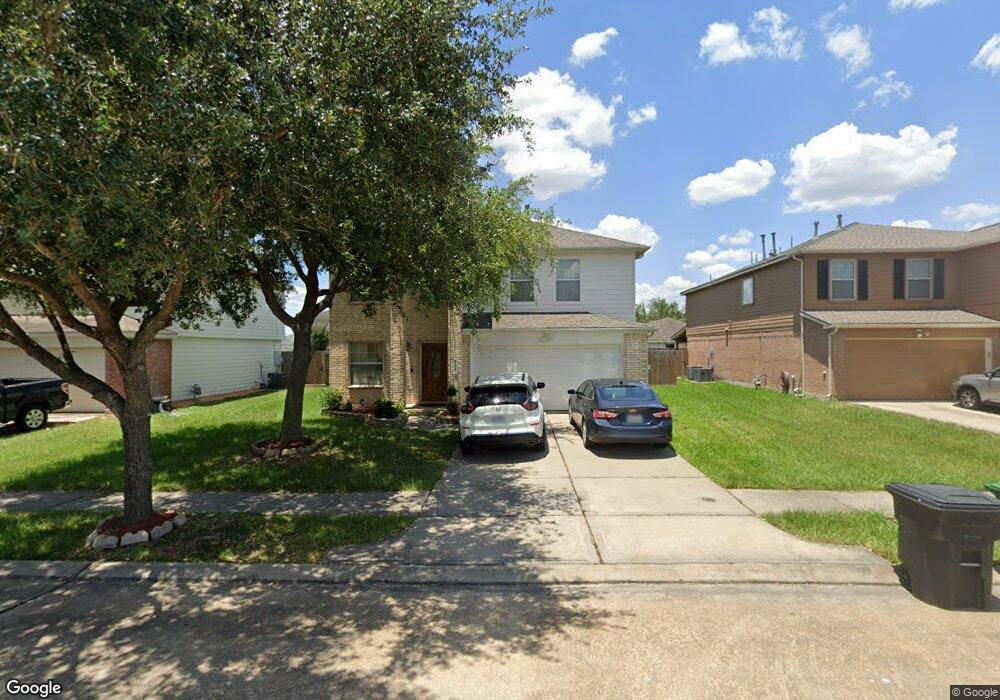
9107 Delmont Park Ln Houston, TX 77075
Southbelt-Ellington NeighborhoodEstimated Value: $306,760 - $325,000
4
Beds
3
Baths
2,816
Sq Ft
$113/Sq Ft
Est. Value
About This Home
This home is located at 9107 Delmont Park Ln, Houston, TX 77075 and is currently estimated at $319,190, approximately $113 per square foot. 9107 Delmont Park Ln is a home located in Harris County with nearby schools including Laura Welch Bush Elementary School, Morris Middle School, and Beverly Hill Intermediate School.
Ownership History
Date
Name
Owned For
Owner Type
Purchase Details
Closed on
Mar 18, 2004
Sold by
Centex Homes
Bought by
Pineda Orlando and Pineda Sonya
Current Estimated Value
Home Financials for this Owner
Home Financials are based on the most recent Mortgage that was taken out on this home.
Original Mortgage
$145,125
Outstanding Balance
$67,350
Interest Rate
5.57%
Mortgage Type
FHA
Estimated Equity
$251,840
Create a Home Valuation Report for This Property
The Home Valuation Report is an in-depth analysis detailing your home's value as well as a comparison with similar homes in the area
Home Values in the Area
Average Home Value in this Area
Purchase History
| Date | Buyer | Sale Price | Title Company |
|---|---|---|---|
| Pineda Orlando | -- | Commerce Title Company |
Source: Public Records
Mortgage History
| Date | Status | Borrower | Loan Amount |
|---|---|---|---|
| Open | Pineda Orlando | $145,125 |
Source: Public Records
Tax History Compared to Growth
Tax History
| Year | Tax Paid | Tax Assessment Tax Assessment Total Assessment is a certain percentage of the fair market value that is determined by local assessors to be the total taxable value of land and additions on the property. | Land | Improvement |
|---|---|---|---|---|
| 2025 | $6,569 | $292,782 | $41,760 | $251,022 |
| 2024 | $6,569 | $306,591 | $41,760 | $264,831 |
| 2023 | $6,569 | $306,591 | $41,760 | $264,831 |
| 2022 | $7,696 | $282,174 | $41,760 | $240,414 |
| 2021 | $7,361 | $233,225 | $36,847 | $196,378 |
| 2020 | $7,250 | $221,630 | $36,847 | $184,783 |
| 2019 | $7,148 | $211,157 | $36,847 | $174,310 |
| 2018 | $2,183 | $189,299 | $31,097 | $158,202 |
| 2017 | $6,162 | $184,811 | $31,097 | $153,714 |
| 2016 | $5,984 | $179,817 | $28,506 | $151,311 |
| 2015 | $4,363 | $166,229 | $25,915 | $140,314 |
| 2014 | $4,363 | $154,347 | $25,915 | $128,432 |
Source: Public Records
Map
Nearby Homes
- 10406 Sutter Glen Ln
- 10518 Tenleyton Ln
- 10506 Pleasant Villas Ln
- 9319 Canady Park Ln
- 0 Fuqua St Unit 64883593
- 0 Fuqua St Unit 45902141
- 0 Fuqua St Unit 97219329
- 7329 Madison Commons Ln
- 7322 Madison Commons Ln
- 10223 Belcamp Ct
- 9307 Fuqua Ridge Ln
- 10307 Collin Park
- 10827 Linden Gate Dr
- 10831 Cayman Mist Dr
- 8706 Danbury Hollow Ln
- 10918 Linden Gate Dr
- 10858 Shannon Mills Ln
- 10847 Nellsfield Ln
- 10934 Bradford Way Dr
- 9423 Garden Bridge St
- 9111 Delmont Park Ln
- 9103 Delmont Park Ln
- 9115 Delmont Park Ln
- 9110 Wolcott Park Ln
- 9106 Wolcott Park Ln
- 9114 Wolcott Park Ln
- 10423 Sutter Glen Ln
- 9119 Delmont Park Ln
- 9118 Wolcott Park Ln
- 10402 Tenleyton Ln
- 10427 Sutter Glen Ln
- 9122 Wolcott Park Ln
- 10414 Sutter Glen Ln
- 10410 Sutter Glen Ln
- 9203 Delmont Park Ln
- 10418 Sutter Glen Ln
- 9202 Wolcott Park Ln
- 10422 Sutter Glen Ln
- 10402 Sutter Glen Ln
- 10431 Sutter Glen Ln