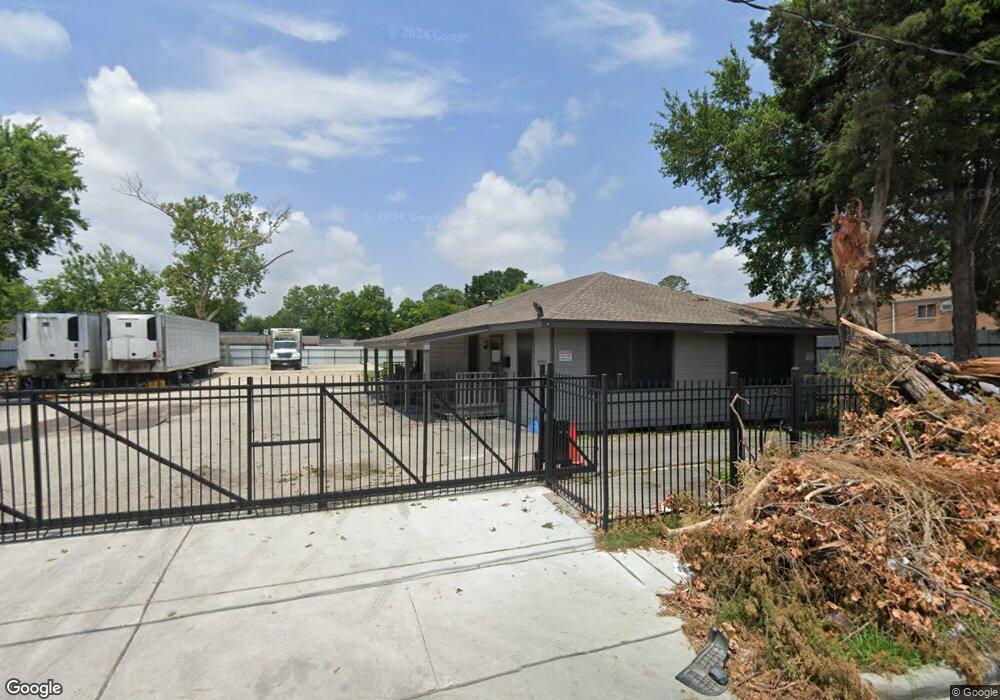
9107 Irvington Blvd Unit 1 Houston, TX 77022
Northside-Northline NeighborhoodEstimated Value: $298,000 - $397,000
2
Beds
1
Bath
1,696
Sq Ft
$205/Sq Ft
Est. Value
About This Home
This home is located at 9107 Irvington Blvd Unit 1, Houston, TX 77022 and is currently estimated at $347,667, approximately $204 per square foot. 9107 Irvington Blvd Unit 1 is a home located in Harris County with nearby schools including Burbank Elementary School, Burbank Middle School, and Sam Houston Math, Science & Technology Center.
Ownership History
Date
Name
Owned For
Owner Type
Purchase Details
Closed on
May 25, 2022
Sold by
Guerra Elva A and Guerra Nelson A
Bought by
Esma Fresh Produce Llc
Current Estimated Value
Home Financials for this Owner
Home Financials are based on the most recent Mortgage that was taken out on this home.
Original Mortgage
$500,000
Outstanding Balance
$444,138
Interest Rate
4.43%
Mortgage Type
Seller Take Back
Estimated Equity
-$96,471
Purchase Details
Closed on
May 24, 2022
Sold by
Elva Guerra
Bought by
Esma Fresh Produce Llc
Home Financials for this Owner
Home Financials are based on the most recent Mortgage that was taken out on this home.
Original Mortgage
$500,000
Outstanding Balance
$444,138
Interest Rate
4.43%
Mortgage Type
Seller Take Back
Estimated Equity
-$96,471
Create a Home Valuation Report for This Property
The Home Valuation Report is an in-depth analysis detailing your home's value as well as a comparison with similar homes in the area
Home Values in the Area
Average Home Value in this Area
Purchase History
| Date | Buyer | Sale Price | Title Company |
|---|---|---|---|
| Esma Fresh Produce Llc | -- | None Listed On Document | |
| Esma Fresh Produce Llc | -- | None Listed On Document |
Source: Public Records
Mortgage History
| Date | Status | Borrower | Loan Amount |
|---|---|---|---|
| Open | Esma Fresh Produce Llc | $500,000 |
Source: Public Records
Tax History Compared to Growth
Tax History
| Year | Tax Paid | Tax Assessment Tax Assessment Total Assessment is a certain percentage of the fair market value that is determined by local assessors to be the total taxable value of land and additions on the property. | Land | Improvement |
|---|---|---|---|---|
| 2025 | $7,596 | $473,908 | $261,360 | $212,548 |
| 2024 | $7,596 | $474,727 | $261,360 | $213,367 |
| 2023 | $7,596 | $302,527 | $108,960 | $193,567 |
| 2022 | $6,189 | $281,086 | $108,960 | $172,126 |
| 2021 | $5,451 | $233,897 | $108,960 | $124,937 |
| 2020 | $4,785 | $197,586 | $108,960 | $88,626 |
| 2019 | $3,040 | $120,142 | $59,928 | $60,214 |
| 2018 | $2,660 | $105,122 | $50,122 | $55,000 |
| 2017 | $2,949 | $116,616 | $59,928 | $56,688 |
| 2016 | $2,832 | $111,982 | $54,480 | $57,502 |
| 2015 | $2,438 | $91,114 | $32,688 | $58,426 |
| 2014 | $2,438 | $91,276 | $32,688 | $58,588 |
Source: Public Records
Map
Nearby Homes
- 1207 Firnat St
- 807 Firnat St
- 702 Pennington St
- 723 Doverside St
- 9026 Mcgallion Rd
- 1104 Charnwood St
- 318 Charlock St
- 88 Berry Rd
- 8411 Berry Brush Ln
- 8402 Berry Green Ln
- 802 Berry Sage Ln
- 411 Berry Rd
- 253 De Boll St
- 249 De Boll St
- 415 Briarcliff Dr
- 9650 E Hardy Rd
- 8205 Appleton St
- 216 Burress St
- 631 Apache St
- 743 Apache St
- 9101 Irvington Blvd
- 923 De Boll St
- 9104 Irvington Blvd
- 9122 Goldcrest St
- 919 De Boll St
- 9019 Irvington Blvd
- 9108 Irvington Blvd
- 826 Hohl St
- 915 De Boll St
- 9126 Goldcrest St
- 924 De Boll St
- 913 De Boll St
- 9011 Irvington Blvd
- 822 Hohl St
- 922 De Boll St
- 9130 Goldcrest St
- 1201 De Boll St
- 920 De Boll St
- 911 De Boll St
- 818 Hohl St