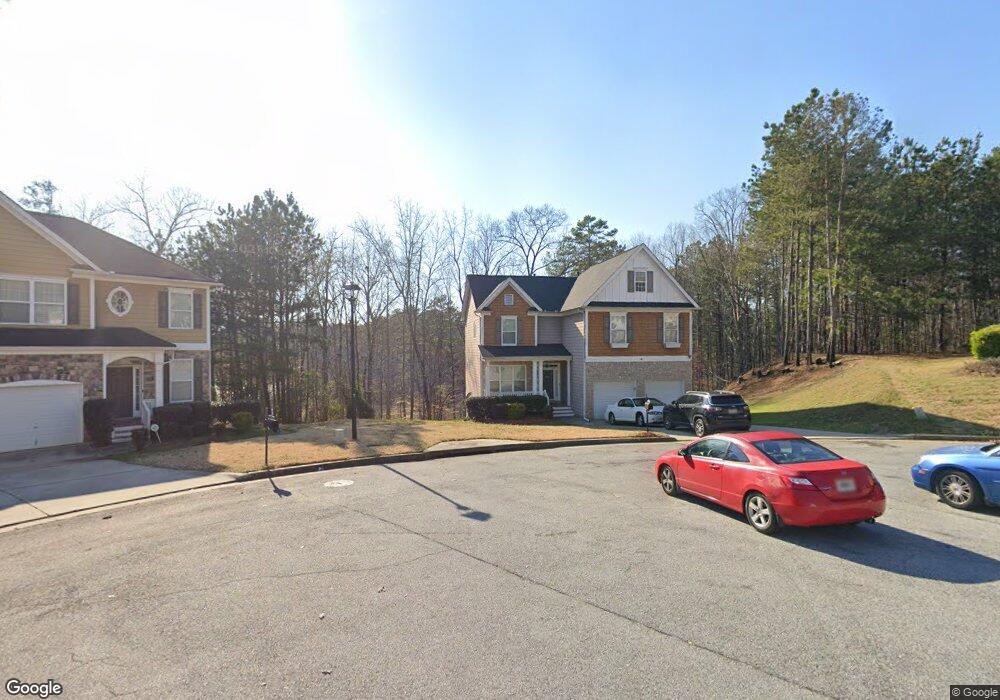
9108 Valleyview Ct Union City, GA 30291
Estimated Value: $276,000 - $296,000
4
Beds
3
Baths
1,888
Sq Ft
$150/Sq Ft
Est. Value
About This Home
This home is located at 9108 Valleyview Ct, Union City, GA 30291 and is currently estimated at $283,974, approximately $150 per square foot. 9108 Valleyview Ct is a home located in Fulton County with nearby schools including Liberty Point Elementary School, Camp Creek Middle School, and Langston Hughes High School.
Ownership History
Date
Name
Owned For
Owner Type
Purchase Details
Closed on
Jan 4, 2011
Sold by
Federal Natl Mtg Assn Fnma
Bought by
Farris Anthony R
Current Estimated Value
Home Financials for this Owner
Home Financials are based on the most recent Mortgage that was taken out on this home.
Original Mortgage
$94,053
Outstanding Balance
$57,993
Interest Rate
2.87%
Mortgage Type
FHA
Estimated Equity
$225,981
Purchase Details
Closed on
Aug 3, 2010
Sold by
Aurora Ln Svcs Llc
Bought by
Federal Natl Mtg Assn Fnma
Purchase Details
Closed on
Feb 22, 2008
Sold by
Marx Richard and Marx Kathy
Bought by
Xmarx Llc
Purchase Details
Closed on
Jul 24, 2007
Sold by
D R Horton Inc
Bought by
Marx Richard and Marx Kathy
Home Financials for this Owner
Home Financials are based on the most recent Mortgage that was taken out on this home.
Original Mortgage
$161,910
Interest Rate
7.65%
Mortgage Type
New Conventional
Create a Home Valuation Report for This Property
The Home Valuation Report is an in-depth analysis detailing your home's value as well as a comparison with similar homes in the area
Home Values in the Area
Average Home Value in this Area
Purchase History
| Date | Buyer | Sale Price | Title Company |
|---|---|---|---|
| Farris Anthony R | -- | -- | |
| Federal Natl Mtg Assn Fnma | -- | -- | |
| Aurora Ln Svcs Llc | $184,448 | -- | |
| Xmarx Llc | -- | -- | |
| Marx Richard | $179,900 | -- |
Source: Public Records
Mortgage History
| Date | Status | Borrower | Loan Amount |
|---|---|---|---|
| Open | Farris Anthony R | $94,053 | |
| Previous Owner | Marx Richard | $161,910 |
Source: Public Records
Tax History Compared to Growth
Tax History
| Year | Tax Paid | Tax Assessment Tax Assessment Total Assessment is a certain percentage of the fair market value that is determined by local assessors to be the total taxable value of land and additions on the property. | Land | Improvement |
|---|---|---|---|---|
| 2025 | $1,357 | $117,760 | $21,800 | $95,960 |
| 2023 | $2,740 | $97,080 | $14,320 | $82,760 |
| 2022 | $1,810 | $97,080 | $14,320 | $82,760 |
| 2021 | $2,173 | $80,080 | $11,040 | $69,040 |
| 2020 | $1,852 | $66,640 | $8,880 | $57,760 |
| 2019 | $2,764 | $65,440 | $8,720 | $56,720 |
| 2018 | $1,636 | $57,960 | $8,040 | $49,920 |
| 2017 | $1,484 | $50,880 | $10,400 | $40,480 |
| 2016 | $1,485 | $50,880 | $10,400 | $40,480 |
| 2015 | $1,571 | $50,880 | $10,400 | $40,480 |
| 2014 | $1,070 | $34,920 | $6,960 | $27,960 |
Source: Public Records
Map
Nearby Homes
- 9515 Lakeview Rd
- 000 Highpoint Rd
- 99 Highpoint Rd
- 9899 Vista Cir
- 4105 Ravenwood Ct Unit 3
- 4812 Station Dr Unit 2
- 4811 Station Dr Unit 35
- 9886 Vista Cir
- 3426 Newgold Trace
- 4121 Ravenwood Ct
- 6320 Littleton Dr
- 0 Highpoint Rd Unit 10553938
- 3317 Stonewall Ln Unit 71
- 4031 Robin Cir
- 4838 Station Lane-Lot 15
- 4837 Station Ln
- 4811 Station Ln
- 3318 Stonewall Ln
- 4813 Station Ln
- 4855 Station Ln
- 9110 Valleyview Ct
- 9106 Valleyview Ct
- 9109 Valleyview Ct
- 9104 Valleyview Ct Unit Ga1331
- 9104 Valleyview Ct
- 9104 Valleyview Ct
- 9104 Valleyview Ct Unit GA13315
- 8836 Lakecrest Way
- 9107 Valleyview Ct
- 9102 Valleyview Ct
- 9105 Valleyview Ct
- 9103 Valleyview Ct
- 8966 Crestview Cir
- 8966 Crestview Cir Unit 34
- 8838 Lakecrest Way
- 8838 Lakecrest Way Unit 8838
- 9100 Valleyview Ct
- 8834 Lakecrest Way
- 9101 Valleyview Ct
- 8964 Crestview Cir