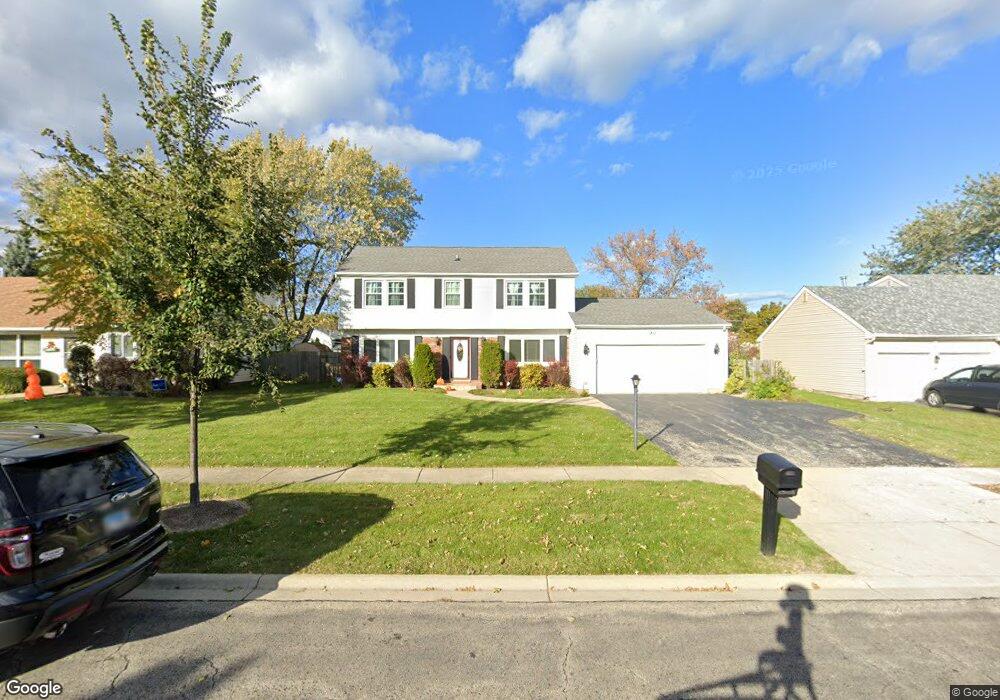
911 Belmar Ln Unit 1 Buffalo Grove, IL 60089
Estimated Value: $495,000 - $571,000
4
Beds
3
Baths
2,000
Sq Ft
$262/Sq Ft
Est. Value
About This Home
This home is located at 911 Belmar Ln Unit 1, Buffalo Grove, IL 60089 and is currently estimated at $524,776, approximately $262 per square foot. 911 Belmar Ln Unit 1 is a home located in Lake County with nearby schools including Ivy Hall Elementary School, Twin Groves Middle School, and Adlai E Stevenson High School.
Ownership History
Date
Name
Owned For
Owner Type
Purchase Details
Closed on
Dec 11, 2013
Sold by
Metzger Teresa
Bought by
Mao Victor and Yan Wenfeng
Current Estimated Value
Home Financials for this Owner
Home Financials are based on the most recent Mortgage that was taken out on this home.
Original Mortgage
$221,000
Outstanding Balance
$60,399
Interest Rate
4.23%
Mortgage Type
New Conventional
Estimated Equity
$464,377
Purchase Details
Closed on
Oct 31, 2005
Sold by
Coclanis Loding Brett and Coclanis Loding Christine
Bought by
Metzger Teresa
Purchase Details
Closed on
Jun 14, 2001
Sold by
Landy Joseph F and Landy Jeanne W
Bought by
Coclanis Loding Brett and Coclanis Loding Christine
Home Financials for this Owner
Home Financials are based on the most recent Mortgage that was taken out on this home.
Original Mortgage
$215,000
Interest Rate
7.11%
Create a Home Valuation Report for This Property
The Home Valuation Report is an in-depth analysis detailing your home's value as well as a comparison with similar homes in the area
Home Values in the Area
Average Home Value in this Area
Purchase History
| Date | Buyer | Sale Price | Title Company |
|---|---|---|---|
| Mao Victor | $295,000 | First American Title | |
| Metzger Teresa | $390,000 | Rtc | |
| Coclanis Loding Brett | $235,000 | Greater Illinois Title Compa |
Source: Public Records
Mortgage History
| Date | Status | Borrower | Loan Amount |
|---|---|---|---|
| Open | Mao Victor | $221,000 | |
| Previous Owner | Coclanis Loding Brett | $215,000 |
Source: Public Records
Tax History Compared to Growth
Tax History
| Year | Tax Paid | Tax Assessment Tax Assessment Total Assessment is a certain percentage of the fair market value that is determined by local assessors to be the total taxable value of land and additions on the property. | Land | Improvement |
|---|---|---|---|---|
| 2024 | $12,891 | $133,184 | $25,475 | $107,709 |
| 2023 | $12,891 | $125,669 | $24,038 | $101,631 |
| 2022 | $12,673 | $121,535 | $23,248 | $98,287 |
| 2021 | $12,199 | $120,224 | $22,997 | $97,227 |
| 2020 | $11,909 | $120,634 | $23,075 | $97,559 |
| 2019 | $11,740 | $120,189 | $22,990 | $97,199 |
| 2018 | $10,718 | $113,091 | $22,719 | $90,372 |
| 2017 | $10,522 | $110,452 | $22,189 | $88,263 |
| 2016 | $10,269 | $105,767 | $21,248 | $84,519 |
| 2015 | $10,033 | $98,912 | $19,871 | $79,041 |
| 2014 | $7,464 | $83,514 | $21,342 | $62,172 |
| 2012 | $7,351 | $83,682 | $21,385 | $62,297 |
Source: Public Records
Map
Nearby Homes
- 950 Belmar Ln
- 1141 Devonshire Rd
- 931 Shady Grove Ln
- 1265 Devonshire Rd
- 1152 Courtland Dr Unit 406
- 1032 Courtland Dr Unit 9
- 12 Cloverdale Ct
- 800 Clohesey Dr
- 890 Knollwood Dr
- 327 Lasalle Ln
- 1118 Larraway Dr
- 711 Woodhollow Ln
- 5107 N Arlington Heights Rd
- 1325 Fairfax Ln
- 610 Checker Dr
- 1324 Fairfax Ln Unit B32
- 887 Saybrook Ln Unit 2
- 1113 Lockwood Dr
- 1546 Brandywyn Ln
- 437 Caren Dr
- 911 Belmar Ln
- 921 Belmar Ln
- 891 Belmar Ln
- 931 Belmar Ln
- 881 Belmar Ln
- 920 Belmar Ln
- 910 Belmar Ln
- 930 Belmar Ln
- 1121 Devonshire Rd
- 1117 Devonshire Rd
- 941 Belmar Ln
- 1125 Devonshire Rd
- 871 Belmar Ln
- 890 Belmar Ln
- 1113 Devonshire Rd
- 940 Belmar Ln
- 1129 Devonshire Rd
- 1109 Devonshire Rd
- 870 Belmar Ln
- 921 Ridgefield Ln