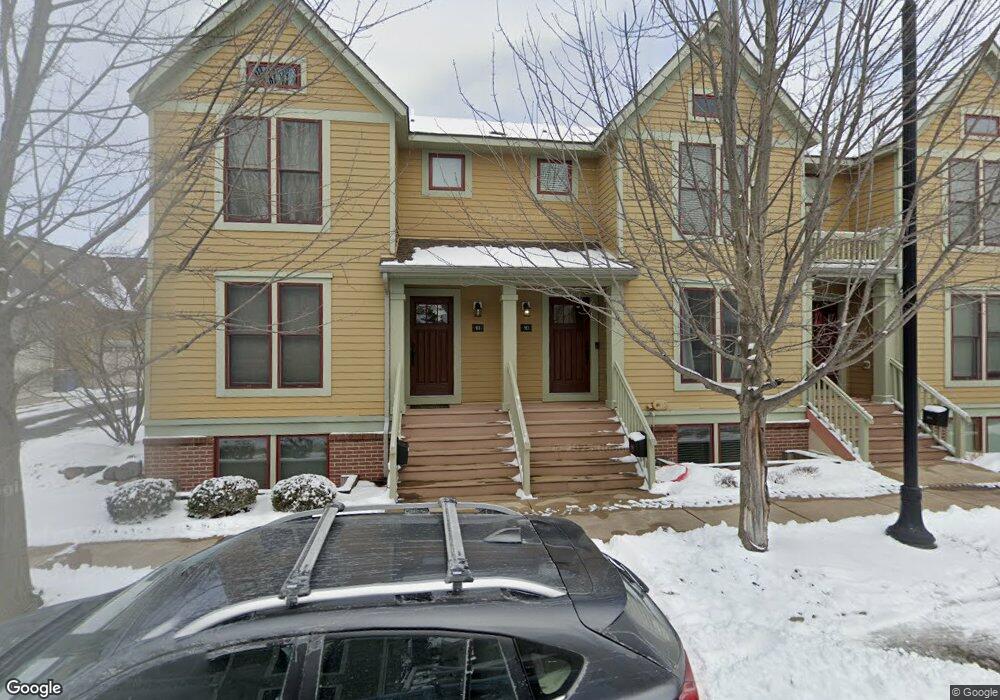
911 Blodgett St SE Unit 11 Grand Rapids, MI 49506
East Hills NeighborhoodEstimated Value: $407,000 - $434,000
3
Beds
3
Baths
1,807
Sq Ft
$230/Sq Ft
Est. Value
About This Home
This home is located at 911 Blodgett St SE Unit 11, Grand Rapids, MI 49506 and is currently estimated at $415,515, approximately $229 per square foot. 911 Blodgett St SE Unit 11 is a home located in Kent County with nearby schools including Martin Luther King Leadership Academy, Alger Middle School, and Ottawa Hills High School.
Ownership History
Date
Name
Owned For
Owner Type
Purchase Details
Closed on
Jan 31, 2025
Sold by
Bell Lyndi A
Bought by
Weiler Adam and Weiler Jenna
Current Estimated Value
Purchase Details
Closed on
May 23, 2013
Sold by
Quinn James D and Katerberg Quinn Kristina
Bought by
Bell Lyndi A
Home Financials for this Owner
Home Financials are based on the most recent Mortgage that was taken out on this home.
Original Mortgage
$152,800
Interest Rate
3.38%
Mortgage Type
New Conventional
Purchase Details
Closed on
May 19, 2010
Sold by
Quinn James D
Bought by
Quinn James D and James D Quinn Trust
Purchase Details
Closed on
Jan 4, 2010
Sold by
Eastbrook Homes Inc
Bought by
Quinn James D
Home Financials for this Owner
Home Financials are based on the most recent Mortgage that was taken out on this home.
Original Mortgage
$157,509
Interest Rate
5.5%
Mortgage Type
FHA
Create a Home Valuation Report for This Property
The Home Valuation Report is an in-depth analysis detailing your home's value as well as a comparison with similar homes in the area
Home Values in the Area
Average Home Value in this Area
Purchase History
| Date | Buyer | Sale Price | Title Company |
|---|---|---|---|
| Weiler Adam | $385,000 | None Listed On Document | |
| Bell Lyndi A | $191,000 | Ppr Title Agency | |
| Quinn James D | -- | None Available | |
| Quinn James D | $172,000 | Grand Rapids Title Agency Ll |
Source: Public Records
Mortgage History
| Date | Status | Borrower | Loan Amount |
|---|---|---|---|
| Previous Owner | Bell Lyndi A | $152,800 | |
| Previous Owner | Quinn James D | $157,509 |
Source: Public Records
Tax History Compared to Growth
Tax History
| Year | Tax Paid | Tax Assessment Tax Assessment Total Assessment is a certain percentage of the fair market value that is determined by local assessors to be the total taxable value of land and additions on the property. | Land | Improvement |
|---|---|---|---|---|
| 2025 | $5,244 | $189,100 | $0 | $0 |
| 2024 | $5,244 | $180,500 | $0 | $0 |
| 2023 | $5,202 | $153,700 | $0 | $0 |
| 2022 | $3,211 | $152,600 | $0 | $0 |
| 2021 | $3,139 | $155,300 | $0 | $0 |
| 2020 | $3,001 | $145,400 | $0 | $0 |
| 2019 | $3,143 | $132,900 | $0 | $0 |
| 2018 | $3,035 | $125,600 | $0 | $0 |
| 2017 | $2,955 | $117,400 | $0 | $0 |
| 2016 | $2,991 | $93,700 | $0 | $0 |
| 2015 | $2,781 | $93,700 | $0 | $0 |
| 2013 | -- | $77,100 | $0 | $0 |
Source: Public Records
Map
Nearby Homes
- 811 Fairmount St SE
- 318 Diamond Ave SE
- 941 Wealthy St SE
- 272 Henry Ave SE
- 240 Calkins Ave SE
- 321 Henry Ave SE
- 1032 Baldwin St SE
- 623 Cherry St SE
- 743 Logan St SE
- 509 Diamond Ave SE
- 1000 Logan St SE
- 1118 Fulton St E
- 1212 Lake Dr SE
- 427 James Ave SE
- 638 Fulton St E Unit A1
- 638 Fulton St E Unit C2
- 638 Fulton St E Unit B1
- 452 Union Ave SE
- 17 Union Ave SE Unit B
- 505 Cherry St SE Unit 301
- 925 Blodgett St SE Unit 910
- 900 Blodgett St SE Unit 35
- 902 Blodgett St SE Unit 34
- 904 Blodgett St SE Unit 33
- 908 Blodgett St SE Unit 31
- 910 Blodgett St SE Unit 30
- 914 Blodgett St SE Unit 29
- 916 Blodgett St SE Unit 910
- 918 Blodgett St SE Unit 27
- 921 Blodgett St SE Unit 16
- 919 Blodgett St SE Unit 15
- 917 Blodgett St SE Unit 14
- 915 Blodgett St SE
- 913 Blodgett St SE Unit 12
- 212 Hollister Ave SE Unit 10
- 214 Hollister Ave SE Unit 9
- 218 Hollister Ave SE Unit 8
- 913 Blodgett St SE
- 919 Blodgett St SE
- 916 Blodgett St SE Unit 1