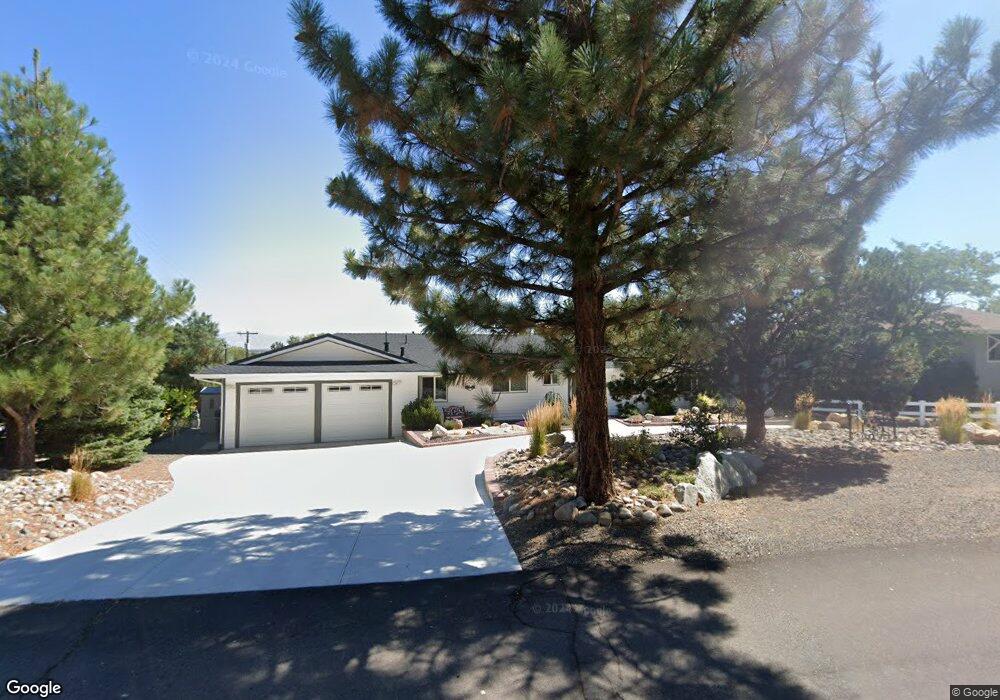
911 Bollen Cir Unit Bollen Ct. Gardnerville, NV 89460
Mottsville NeighborhoodEstimated Value: $667,064 - $800,000
--
Bed
7
Baths
1,752
Sq Ft
$421/Sq Ft
Est. Value
About This Home
This home is located at 911 Bollen Cir Unit Bollen Ct., Gardnerville, NV 89460 and is currently estimated at $738,016, approximately $421 per square foot. 911 Bollen Cir Unit Bollen Ct. is a home located in Douglas County with nearby schools including Gene Scarselli Elementary School, Pau Wa Lu Middle School, and Douglas County High School.
Ownership History
Date
Name
Owned For
Owner Type
Purchase Details
Closed on
Aug 18, 2022
Sold by
Koski and Daniel
Bought by
Koski Constance and Hylton Sara Lynn
Current Estimated Value
Purchase Details
Closed on
Nov 22, 2019
Sold by
Rao Lucille J
Bought by
Kolski Constance and Kolski Daniel
Home Financials for this Owner
Home Financials are based on the most recent Mortgage that was taken out on this home.
Original Mortgage
$735,000
Interest Rate
3.19%
Mortgage Type
FHA
Purchase Details
Closed on
Nov 10, 2005
Sold by
Rao Lucille J
Bought by
Rao Ricky and Rao Lucille J
Home Financials for this Owner
Home Financials are based on the most recent Mortgage that was taken out on this home.
Original Mortgage
$325,000
Interest Rate
6.5%
Mortgage Type
Adjustable Rate Mortgage/ARM
Create a Home Valuation Report for This Property
The Home Valuation Report is an in-depth analysis detailing your home's value as well as a comparison with similar homes in the area
Home Values in the Area
Average Home Value in this Area
Purchase History
| Date | Buyer | Sale Price | Title Company |
|---|---|---|---|
| Koski Constance | -- | None Listed On Document | |
| Kolski Constance | $490,000 | Western Title Company | |
| Rao Ricky | -- | None Available | |
| Rao Lucille J | -- | First American Title Company |
Source: Public Records
Mortgage History
| Date | Status | Borrower | Loan Amount |
|---|---|---|---|
| Previous Owner | Kolski Constance | $735,000 | |
| Previous Owner | Rao Lucille J | $325,000 |
Source: Public Records
Tax History Compared to Growth
Tax History
| Year | Tax Paid | Tax Assessment Tax Assessment Total Assessment is a certain percentage of the fair market value that is determined by local assessors to be the total taxable value of land and additions on the property. | Land | Improvement |
|---|---|---|---|---|
| 2025 | $2,168 | $99,444 | $54,250 | $45,194 |
| 2024 | $2,168 | $98,949 | $54,250 | $44,699 |
| 2023 | $2,105 | $95,556 | $54,250 | $41,306 |
| 2022 | $2,044 | $86,511 | $48,300 | $38,211 |
| 2021 | $1,984 | $79,271 | $42,000 | $37,271 |
| 2020 | $1,926 | $78,561 | $42,000 | $36,561 |
| 2019 | $1,859 | $74,775 | $38,500 | $36,275 |
| 2018 | $1,805 | $67,751 | $31,500 | $36,251 |
| 2017 | $1,753 | $65,451 | $28,000 | $37,451 |
| 2016 | $1,708 | $60,398 | $21,000 | $39,398 |
| 2015 | $1,733 | $60,398 | $21,000 | $39,398 |
| 2014 | $1,688 | $58,866 | $21,000 | $37,866 |
Source: Public Records
Map
Nearby Homes
- 896 Evan Ct
- 1004 Lakeside Dr
- 301 Five Creek Rd
- 804 Foothill Rd
- 880 Stutler Creek Ct
- 259 Five Creek Rd
- 210 Sheridan Creek Ct
- 775 Foothill Rd
- 584 W Fork Vista Ln
- 233 Sierra Country Cir
- 423 Claire Ct
- 150 Summit Ridge Way
- 123 Five Creek Rd
- 824 Eagle Meadows Ln
- 168 Five Creek Rd
- 1147 Autumn Hills Rd
- 150 Five Creek Rd
- 615 W Fork Vista Ln
- 490 Nature's Edge Rd
- 600 Artemesia Ln
- 911 Bollen Cir
- 901 Bollen Cir Unit 1
- 921 Bollen Cir
- 396 Russell Way
- 925 Bollen Cir
- 935 Foothill Rd Unit 1
- 920 Bollen Cir
- 402 Russell Way
- 391 Tucke Ct
- 891 Bollen Cir
- 890 Barber Way
- 900 Bollen Cir
- 896 Bollen Cir
- 924 Bollen Cir
- 931 Bollen Cir
- 404 Russell Way
- 393 Tucke Ct
- 890 Bollen Cir
- 887 Bollen Cir
- 880 Barber Way