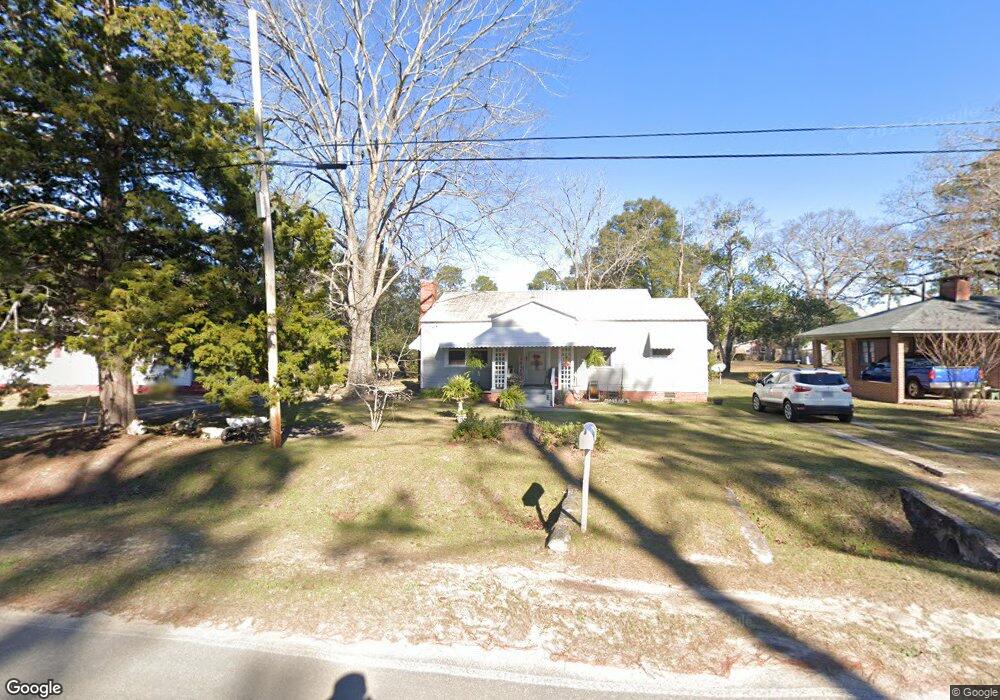
911 E 4th Ave Cordele, GA 31015
Estimated Value: $71,000 - $100,000
1
Bed
1
Bath
866
Sq Ft
$92/Sq Ft
Est. Value
About This Home
This home is located at 911 E 4th Ave, Cordele, GA 31015 and is currently estimated at $79,351, approximately $91 per square foot. 911 E 4th Ave is a home located in Crisp County with nearby schools including Crisp County Elementary School, Crisp County Primary School, and Crisp County Middle School.
Ownership History
Date
Name
Owned For
Owner Type
Purchase Details
Closed on
Oct 11, 2005
Sold by
Watson Cecil Richard
Bought by
Womack Cathy Renea
Current Estimated Value
Home Financials for this Owner
Home Financials are based on the most recent Mortgage that was taken out on this home.
Original Mortgage
$31,900
Outstanding Balance
$16,811
Interest Rate
5.71%
Mortgage Type
New Conventional
Estimated Equity
$62,540
Purchase Details
Closed on
Jun 9, 2000
Sold by
Cantrell Robert L
Bought by
Watson Cecil
Purchase Details
Closed on
Apr 26, 2000
Sold by
Cantrell Bonnie
Bought by
Cantrell Robert L
Purchase Details
Closed on
Nov 29, 1996
Sold by
Cantrell Robt L
Bought by
Cantrell Bonnie
Purchase Details
Closed on
Oct 9, 1987
Sold by
Cantrell B G
Bought by
Cantrell Robt L
Purchase Details
Closed on
Sep 14, 1955
Bought by
Cantrell B G
Create a Home Valuation Report for This Property
The Home Valuation Report is an in-depth analysis detailing your home's value as well as a comparison with similar homes in the area
Purchase History
| Date | Buyer | Sale Price | Title Company |
|---|---|---|---|
| Womack Cathy Renea | $31,900 | -- | |
| Watson Cecil | $30,000 | -- | |
| Cantrell Robert L | -- | -- | |
| Cantrell Bonnie | -- | -- | |
| Cantrell Robt L | -- | -- | |
| Cantrell B G | -- | -- |
Source: Public Records
Mortgage History
| Date | Status | Borrower | Loan Amount |
|---|---|---|---|
| Open | Womack Cathy Renea | $31,900 |
Source: Public Records
Tax History
| Year | Tax Paid | Tax Assessment Tax Assessment Total Assessment is a certain percentage of the fair market value that is determined by local assessors to be the total taxable value of land and additions on the property. | Land | Improvement |
|---|---|---|---|---|
| 2025 | $564 | $15,998 | $3,344 | $12,654 |
| 2024 | $533 | $14,882 | $3,344 | $11,538 |
| 2023 | $474 | $12,652 | $1,672 | $10,980 |
| 2022 | $320 | $12,094 | $1,672 | $10,422 |
| 2021 | $313 | $11,536 | $1,672 | $9,864 |
| 2020 | $325 | $11,536 | $1,672 | $9,864 |
| 2019 | $327 | $11,536 | $1,672 | $9,864 |
| 2018 | $371 | $12,578 | $2,508 | $10,070 |
| 2017 | $511 | $12,578 | $2,508 | $10,070 |
| 2016 | $372 | $12,578 | $2,508 | $10,070 |
| 2015 | -- | $12,578 | $2,508 | $10,070 |
| 2014 | -- | $12,578 | $2,508 | $10,070 |
| 2013 | -- | $12,578 | $2,508 | $10,070 |
Source: Public Records
Map
Nearby Homes
- 824 E 3rd Ave
- 703 N Pecan St
- 405 N Bay St
- 1102 N 3rd St
- 413 E 2nd Ave
- 612 E 12th Ave
- 807 E 14th Ave
- 812 E 14th Ave
- 511 E 13th Ave
- 315 E 12th Ave
- 715 E 17th Ave
- 709 Fleming Rd
- 2413 S Ga 41 Hwy
- 312 E 14th Ave
- 716 E 18th Ave
- 1002 Camellia Dr
- 720 E 20th Ave
- 316 E 18th Ave
- 1012 E 21st Ave
- 1509 E 20th Ave
Your Personal Tour Guide
Ask me questions while you tour the home.