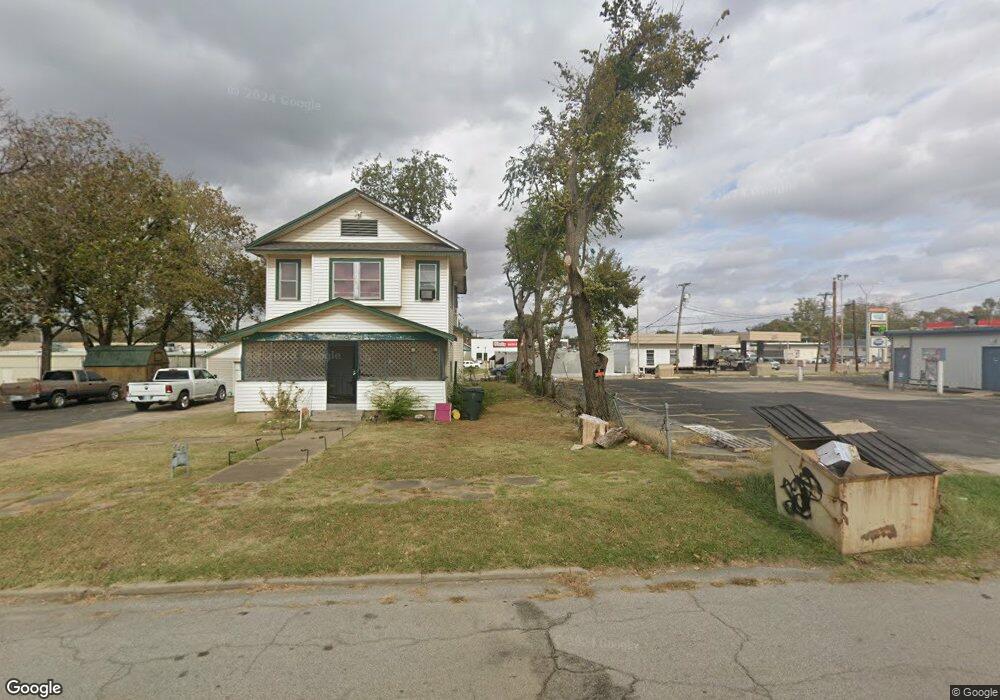
911 E 9th St Okmulgee, OK 74447
Estimated Value: $92,000 - $158,000
3
Beds
2
Baths
1,832
Sq Ft
$70/Sq Ft
Est. Value
About This Home
This home is located at 911 E 9th St, Okmulgee, OK 74447 and is currently estimated at $127,867, approximately $69 per square foot. 911 E 9th St is a home located in Okmulgee County with nearby schools including Okmulgee Primary School, Dunbar Elementary School, and Okmulgee Middle School.
Ownership History
Date
Name
Owned For
Owner Type
Purchase Details
Closed on
Jul 8, 2025
Sold by
Rhino Properties & Renovations Llc
Bought by
Martin Fuller Investments Llc
Current Estimated Value
Home Financials for this Owner
Home Financials are based on the most recent Mortgage that was taken out on this home.
Original Mortgage
$128,805
Outstanding Balance
$125,186
Interest Rate
6.89%
Mortgage Type
Credit Line Revolving
Estimated Equity
$2,681
Purchase Details
Closed on
Nov 11, 2008
Sold by
Day Eldon and Day Tamra
Bought by
Martin John David and Martin Jessica
Purchase Details
Closed on
Feb 10, 2006
Sold by
Day Eldon and Day Tamra
Bought by
Rhodes Christopher and Rhodes Jamie
Purchase Details
Closed on
Oct 20, 2004
Sold by
Gibbon Richard D and Gibbon Anaee
Bought by
Day Eldon and Day Wife
Create a Home Valuation Report for This Property
The Home Valuation Report is an in-depth analysis detailing your home's value as well as a comparison with similar homes in the area
Home Values in the Area
Average Home Value in this Area
Purchase History
| Date | Buyer | Sale Price | Title Company |
|---|---|---|---|
| Martin Fuller Investments Llc | $123,000 | Oklahoma Secured Title | |
| Martin Fuller Investments Llc | $123,000 | Oklahoma Secured Title | |
| Martin John David | -- | None Available | |
| Rhodes Christopher | $46,000 | None Available | |
| Day Eldon | $35,000 | -- |
Source: Public Records
Mortgage History
| Date | Status | Borrower | Loan Amount |
|---|---|---|---|
| Open | Martin Fuller Investments Llc | $128,805 | |
| Closed | Martin Fuller Investments Llc | $128,805 |
Source: Public Records
Tax History
| Year | Tax Paid | Tax Assessment Tax Assessment Total Assessment is a certain percentage of the fair market value that is determined by local assessors to be the total taxable value of land and additions on the property. | Land | Improvement |
|---|---|---|---|---|
| 2025 | $526 | $5,739 | $720 | $5,019 |
| 2024 | $495 | $5,466 | $720 | $4,746 |
| 2023 | $491 | $5,664 | $720 | $4,944 |
| 2022 | $479 | $5,664 | $720 | $4,944 |
| 2021 | $501 | $5,664 | $720 | $4,944 |
| 2020 | $501 | $5,665 | $720 | $4,945 |
| 2019 | $488 | $5,530 | $720 | $4,810 |
| 2018 | $495 | $5,530 | $720 | $4,810 |
| 2017 | $505 | $5,706 | $717 | $4,989 |
| 2016 | $482 | $5,434 | $683 | $4,751 |
| 2015 | $446 | $5,175 | $497 | $4,678 |
| 2014 | $427 | $4,929 | $474 | $4,455 |
Source: Public Records
Map
Nearby Homes
- 901 E 9th E Hwy 75 St Unit 901
- 320 S Wood Dr
- 916 E 8th St
- 1002 E 9th St
- 706 S Choctaw Ave
- 1010 E 9th St
- 1000 E 10th St
- 1013 E 9th St
- 900 E 7th St
- 1009 E 8th St
- 1014 E 9th St
- 918 E 7th St
- 1017 E 9th St
- 200 S Wood Dr
- 1018 E 9th St
- 1021 E 9th St
- 200 S Choctaw Ave
- 1020 E 9th St
- 1020 E 8th St
- 416 S Osage Ave
Your Personal Tour Guide
Ask me questions while you tour the home.