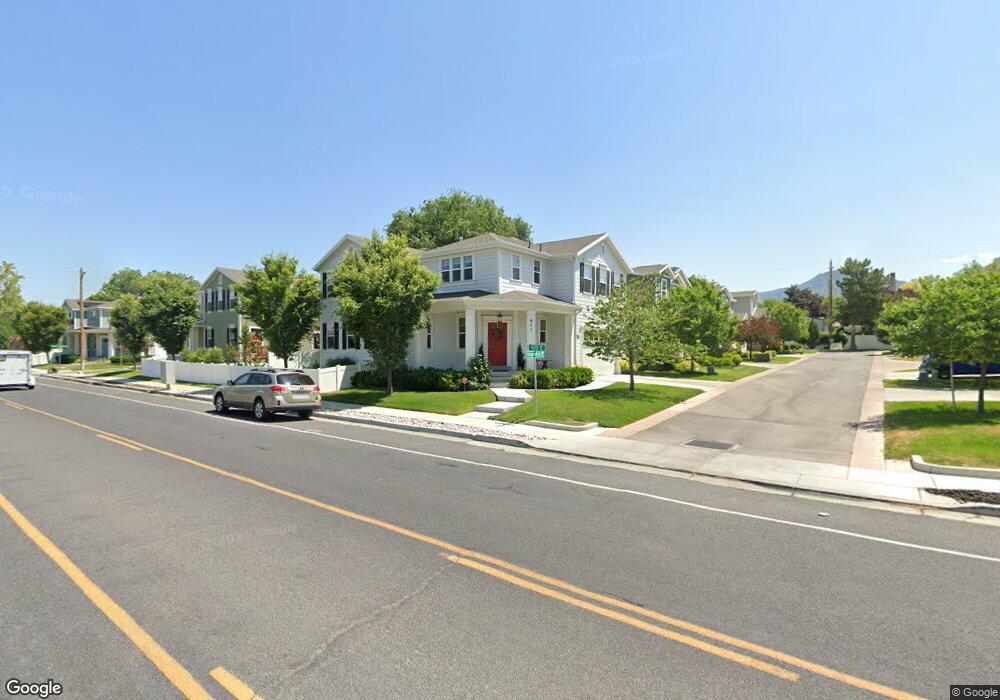
911 E Kingsmill Ln Salt Lake City, UT 84106
Estimated Value: $842,000 - $942,000
4
Beds
4
Baths
3,556
Sq Ft
$253/Sq Ft
Est. Value
About This Home
This home is located at 911 E Kingsmill Ln, Salt Lake City, UT 84106 and is currently estimated at $898,325, approximately $252 per square foot. 911 E Kingsmill Ln is a home located in Salt Lake County with nearby schools including Nibley Park School, Highland High School, and Summit Christian Academy.
Ownership History
Date
Name
Owned For
Owner Type
Purchase Details
Closed on
Mar 26, 2021
Sold by
Lemone Jason and Lemone Christina
Bought by
Lemone Jason and Lemone Christina
Current Estimated Value
Home Financials for this Owner
Home Financials are based on the most recent Mortgage that was taken out on this home.
Original Mortgage
$397,000
Outstanding Balance
$357,865
Interest Rate
2.9%
Mortgage Type
New Conventional
Estimated Equity
$540,460
Purchase Details
Closed on
Jan 7, 2021
Sold by
Lemone Jason and Lemone Christina
Bought by
Lemone Jason and Lemone Christina
Purchase Details
Closed on
Mar 22, 2018
Sold by
Cottage Place Llc
Bought by
Lemone Jason A and Lemone Christina L
Home Financials for this Owner
Home Financials are based on the most recent Mortgage that was taken out on this home.
Original Mortgage
$505,674
Interest Rate
4.32%
Mortgage Type
New Conventional
Purchase Details
Closed on
Nov 29, 2017
Sold by
Land Developments Llc
Bought by
Cottage Placce Llc
Create a Home Valuation Report for This Property
The Home Valuation Report is an in-depth analysis detailing your home's value as well as a comparison with similar homes in the area
Home Values in the Area
Average Home Value in this Area
Purchase History
| Date | Buyer | Sale Price | Title Company |
|---|---|---|---|
| Lemone Jason | -- | Accommodation | |
| Lemone Jason | -- | Accommodation | |
| Lemone Jason | -- | None Available | |
| Lemone Jason A | -- | Us Title | |
| Cottage Placce Llc | -- | Monument Title Ins Co |
Source: Public Records
Mortgage History
| Date | Status | Borrower | Loan Amount |
|---|---|---|---|
| Open | Lemone Jason | $397,000 | |
| Closed | Lemone Jason A | $505,674 |
Source: Public Records
Tax History Compared to Growth
Tax History
| Year | Tax Paid | Tax Assessment Tax Assessment Total Assessment is a certain percentage of the fair market value that is determined by local assessors to be the total taxable value of land and additions on the property. | Land | Improvement |
|---|---|---|---|---|
| 2025 | $4,537 | $927,100 | $144,700 | $782,400 |
| 2024 | $4,537 | $865,700 | $140,300 | $725,400 |
| 2023 | $4,385 | $806,500 | $112,100 | $694,400 |
| 2022 | $4,679 | $807,400 | $109,800 | $697,600 |
| 2021 | $4,059 | $634,100 | $84,500 | $549,600 |
| 2020 | $3,886 | $577,800 | $79,800 | $498,000 |
| 2019 | $3,956 | $553,400 | $72,300 | $481,100 |
| 2018 | $1,494 | $203,600 | $72,300 | $131,300 |
| 2017 | $0 | $0 | $0 | $0 |
Source: Public Records
Map
Nearby Homes
- 920 E Queensmill Ln
- 3130 S 1000 E
- 878 E Elgin Ave
- 1028 E Mansfield Ave
- 2937 S 900 E
- 821 E Spring View Dr S
- 786 E Lake Cir
- 829 E Zenith Ave
- 766 E Spring View Dr
- 3091 S 700 E
- 736 E 3155 S
- 3073 S 700 E
- 2922 S 800 E
- 743 E Garden Ave
- 746 E Zenith Ave
- 3379 S 900 E
- 964 E 3385 S
- 2970 S Richmond St
- 3431 Brookview Ln
- 3346 S 700 E
- 915 E Kingsmill Ln
- 3101 S 900 E
- 908 E Queensmill Ln Unit 208
- 910 E Kingsmill Ln
- 919 E Kingsmill Ln
- 3127 S 900 E
- 914 E Kingsmill Ln
- 914 E Kingsmill Ln Unit 107
- 912 E Queensmill Ln
- 3089 S 900 E
- 3108 S 900 E
- 918 E Kingsmill Ln
- 916 E Queensmill Ln
- 3086 S 900 E
- 923 E Kingsmill Ln
- 3100 S 900 E
- 909 E Queensmill Ln
- 922 E Kingsmill Ln
- 920 E Queensmill Ln Unit 205
- 913 E Queensmill Ln Unit 202