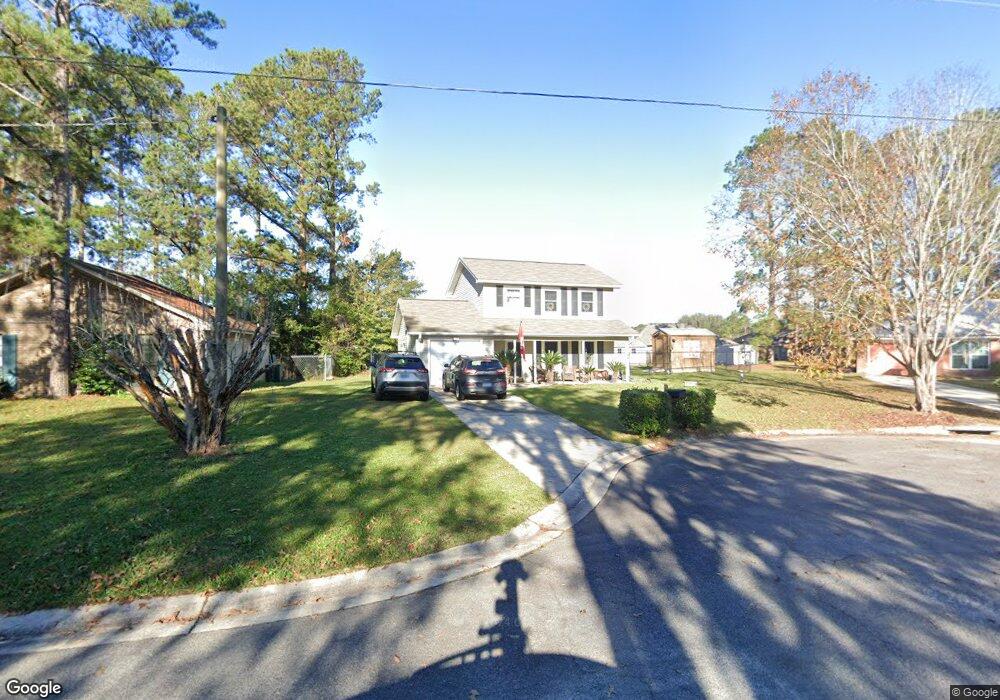
911 Granger Dr Hinesville, GA 31313
Estimated Value: $191,000 - $228,000
3
Beds
2
Baths
1,450
Sq Ft
$147/Sq Ft
Est. Value
About This Home
This home is located at 911 Granger Dr, Hinesville, GA 31313 and is currently estimated at $213,617, approximately $147 per square foot. 911 Granger Dr is a home located in Liberty County with nearby schools including Waldo Pafford Elementary School, Snelson-Golden Middle School, and Bradwell Institute.
Ownership History
Date
Name
Owned For
Owner Type
Purchase Details
Closed on
Mar 25, 2022
Sold by
Williams Charity L
Bought by
Williams Charity L and Herrel Stephanie
Current Estimated Value
Home Financials for this Owner
Home Financials are based on the most recent Mortgage that was taken out on this home.
Original Mortgage
$65,000
Outstanding Balance
$52,453
Interest Rate
3.15%
Mortgage Type
New Conventional
Estimated Equity
$161,164
Purchase Details
Closed on
Dec 23, 2002
Sold by
Herrod Shery D
Bought by
Williams Charity L
Purchase Details
Closed on
Jan 2, 2002
Sold by
Herrod Sheryl D
Bought by
Bankers Trust Company Of California Na
Purchase Details
Closed on
Dec 31, 1997
Sold by
Secretary Of Va
Bought by
Herrod Shery D
Purchase Details
Closed on
Jul 1, 1997
Sold by
Norwest Mortgage
Bought by
Secretary Of Va
Purchase Details
Closed on
Feb 17, 1995
Bought by
Allen Mitchell L and Allen D
Create a Home Valuation Report for This Property
The Home Valuation Report is an in-depth analysis detailing your home's value as well as a comparison with similar homes in the area
Home Values in the Area
Average Home Value in this Area
Purchase History
| Date | Buyer | Sale Price | Title Company |
|---|---|---|---|
| Williams Charity L | -- | -- | |
| Williams Charity L | $65,000 | -- | |
| Bankers Trust Company Of California Na | -- | -- | |
| Herrod Shery D | $62,300 | -- | |
| Secretary Of Va | -- | -- | |
| Norwest Mortgage | $58,800 | -- | |
| Allen Mitchell L | $66,100 | -- |
Source: Public Records
Mortgage History
| Date | Status | Borrower | Loan Amount |
|---|---|---|---|
| Open | Williams Charity L | $65,000 |
Source: Public Records
Tax History Compared to Growth
Tax History
| Year | Tax Paid | Tax Assessment Tax Assessment Total Assessment is a certain percentage of the fair market value that is determined by local assessors to be the total taxable value of land and additions on the property. | Land | Improvement |
|---|---|---|---|---|
| 2024 | $3,024 | $65,451 | $12,000 | $53,451 |
| 2023 | $3,024 | $58,637 | $12,000 | $46,637 |
| 2022 | $1,575 | $47,816 | $9,600 | $38,216 |
| 2021 | $1,819 | $42,078 | $9,600 | $32,478 |
| 2020 | $1,664 | $38,481 | $7,200 | $31,281 |
| 2019 | $1,671 | $38,872 | $7,200 | $31,672 |
| 2018 | $1,666 | $38,933 | $7,200 | $31,733 |
| 2017 | $1,184 | $35,945 | $7,200 | $28,745 |
| 2016 | $1,474 | $36,298 | $7,200 | $29,098 |
| 2015 | $1,561 | $36,298 | $7,200 | $29,098 |
| 2014 | $1,561 | $37,826 | $7,200 | $30,626 |
| 2013 | -- | $38,460 | $6,400 | $32,060 |
Source: Public Records
Map
Nearby Homes
- 1112 Cornett Ct
- 1117 Cornett Ct
- 14.96 Ac Ellie Ln
- 1072 Ricade Dr
- 1103 Ricade Dr
- 950 Elma G Miles Pkwy
- 1100 Pineland Ave Unit 2D
- 1091 Kelly Dr
- 1106 Ricade Dr
- 951 Elma G Miles Pkwy
- 1.05 AC Elma G Miles Pkwy
- 823 Elma G Miles Pkwy
- 1.09 AC Elma G Miles Pkwy
- .58 AC Elma G Miles Pkwy
- 970 Whippoorwill Way
- 0 Elma G Miles Pkwy Unit 324139
- 253 Glenn Bryant Rd
- 979B Pineland Ave Unit B
- 979B Pineland Ave
- 144 Alcott Cir
- 913 Granger Dr
- 0 Granger Dr Unit 7247470
- 909 Granger Dr
- 1104 Cornett Ct
- 1106 Cornett Ct
- 907 Granger Dr
- 1102 Cornett Ct
- 915 Granger Dr
- 1108 Cornett Ct
- 912 Granger Dr
- 905 Granger Dr
- 911 Amanda Ln
- 914 Granger Dr
- 1110 Cornett Ct
- 917 Granger Dr Unit n/a
- 903 Granger Dr
- 902 Granger Dr
- 907 Brockton Dr
- 1112 Cornett Ct Unit COURT
- 1107 Cornett Ct